Geospatial Data Science for Public Health Surveillance
Paula Moraga, Ph.D.
Assistant Professor of Statistics
King Abdullah University of Science
and Technology (KAUST), Saudi Arabia
Books
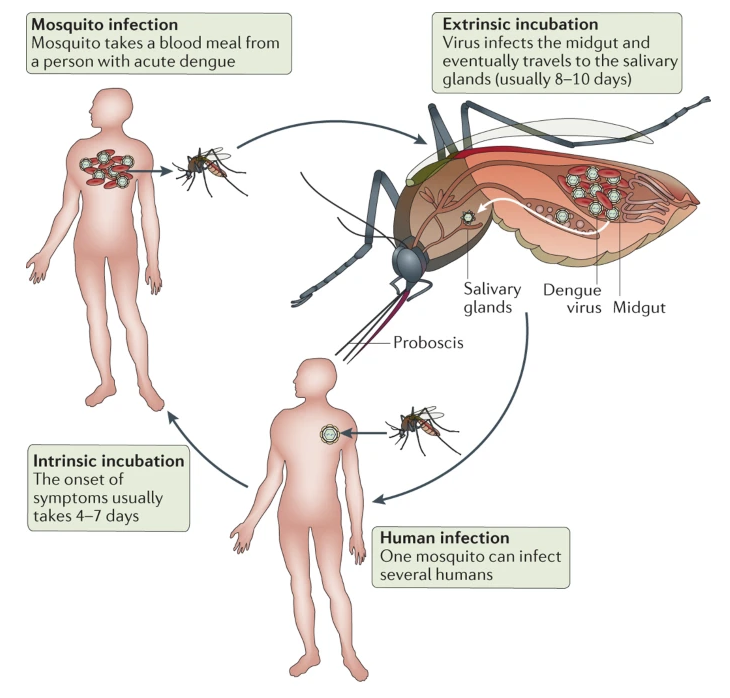
Dengue emergency 2024
Mosquito-borne diseases
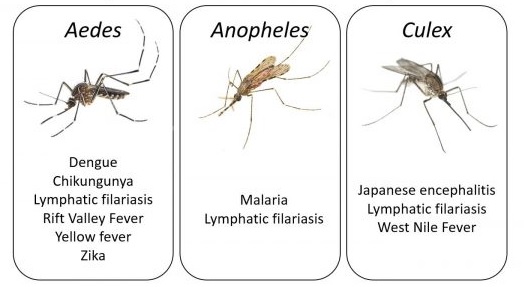
Diseases spread because when a mosquito bites an infected person it also swallows any viruses or parasites living in the blood of the infected person, and these can be transferred to the next person the mosquito bites
Mosquito-borne diseases
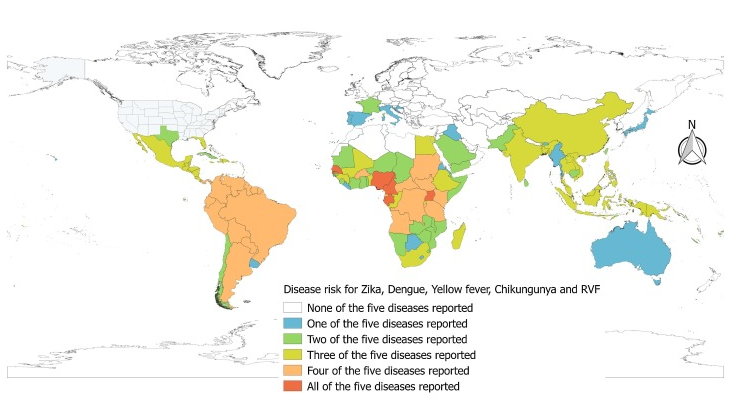
Leta et al., International Journal of Infectious Diseases, 2018
What can we do to prevent the spread of infectious diseases?
Need to acknowledge connectivity between people, animals, and their shared environment and work together to prevent disease outbreaks and save lives
Access to healthcare
and education

Vaccine development and mosquito control

Early warning and response systems
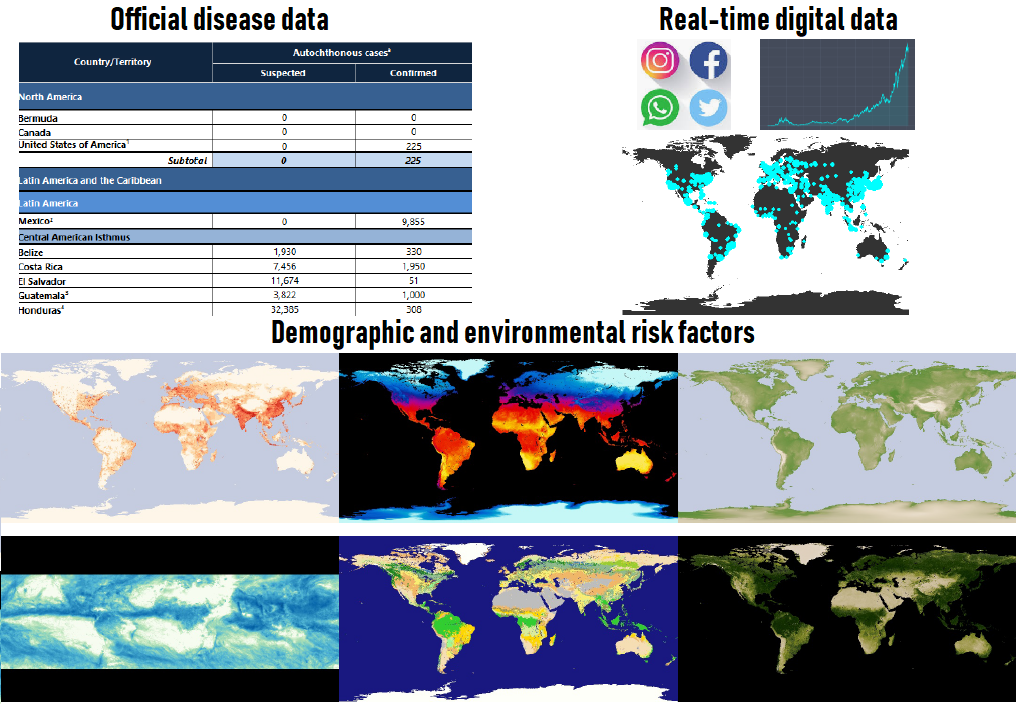
Disease surveillance systems
Disease surveillance systems are critical to early detection of epidemics and the design of control strategies
Traditional surveillance systems rely on data gathered with a considerable delay and make surveillance systems ineffective for real-time surveillance


Digital data sources
Real-time digital information may enable to detect outbreaks earlier

“Flu plus fever, not a good way to start the weekend”
“I’m so irritated at this cough and fever”
“This flu, fever & throat ache won’t let me sleep”
Demographic and environmental risk factors
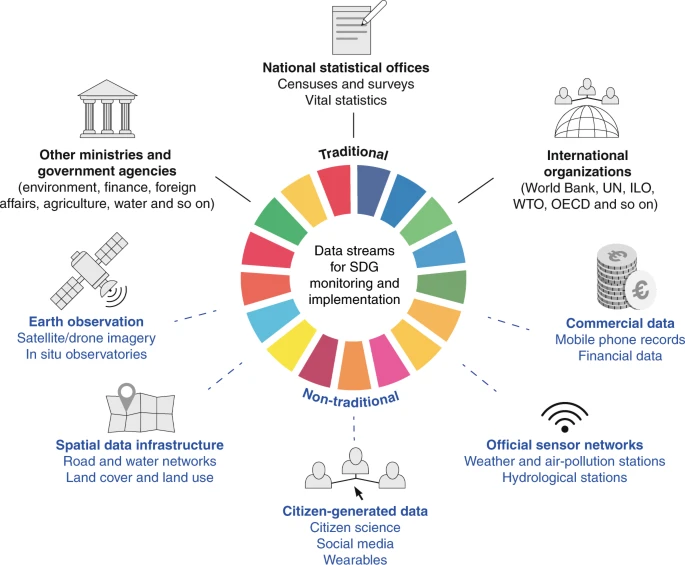
Digital health surveillance system
Data-gathering platform and modelling framework that integrates multiple data sources to produce local probabilistic predictions of disease activity
Interactive dashboard that alerts public health officials when elevated disease levels are anticipated, and provides insights about disease drivers
Brazil faced a severe dengue epidemic in 2024
2024 has been the worst year for dengue cases on record, with over 10 million cases reported globally. Brazil has been one of the most affected countries with over 6 million confirmed cases and 6,000 deaths
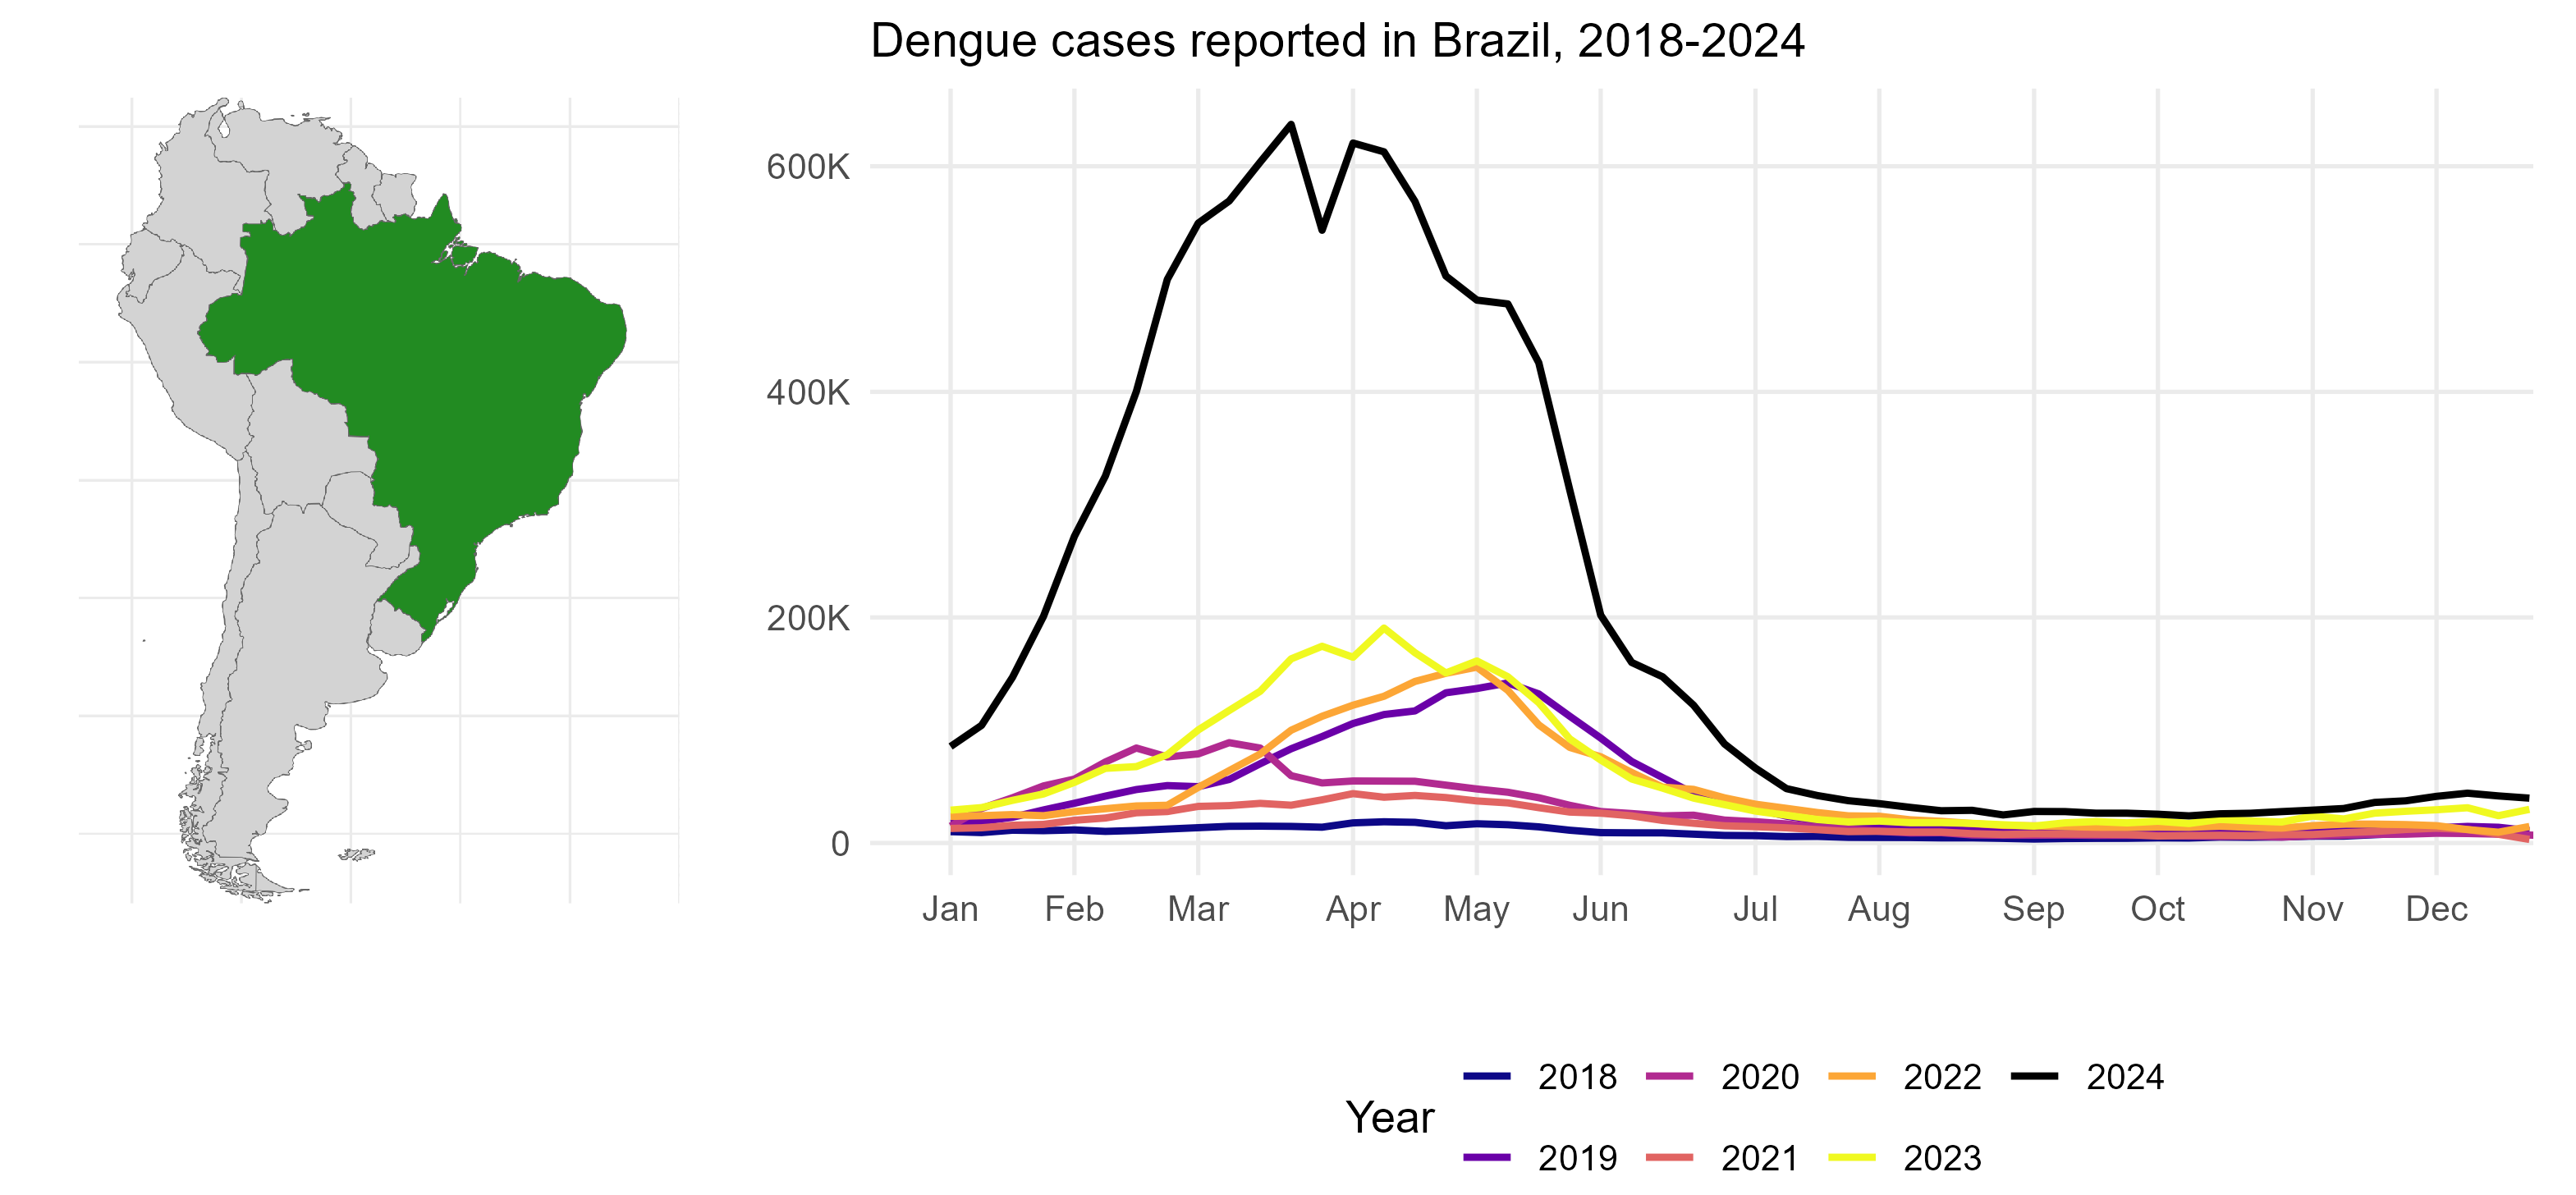
Dengue epidemic in Brazil
During this time, health systems in Brazil were overwhelmed, making timely case reporting difficult. As a result, the official case numbers that were being reported were underestimating the real number of cases.
This limited the effectiveness of public health decisions
Reporting delays in official dengue cases
In Brazil, the InfoDengue system collects and generates indicators of dengue and other arboviruses:
In principle, dengue is meant to be reported within seven days of case identification. In practice,
- Less than 50% cases are reported within one week
- Less than 75% cases reported within four weeks
- No more than 90% cases reported within nine weeks
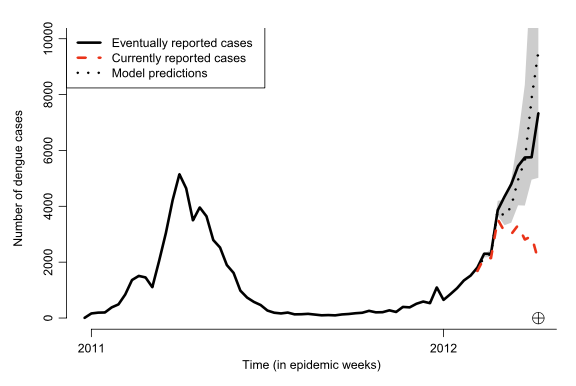
Reported dengue cases in Rio de Janeiro, January 2011 to April 2012. Red line reported cases for those weeks.
Black line eventually reported cases after 10 weeks.
Dengue nowcasting by combining official and alternative data sources
We decided to investigate alternative data sources to complement official surveillance data to produce more accurate predictions that help support decision-making
Aim: improving dengue nowcasting in Brazil using real-time search query data

Google Trends data
Google Trends index for a specific keyword is an index ranging from 0 to 100. Calculated using the number of searches for that keyword divided by the total number of searches of the region and time period considered to compare relative popularity
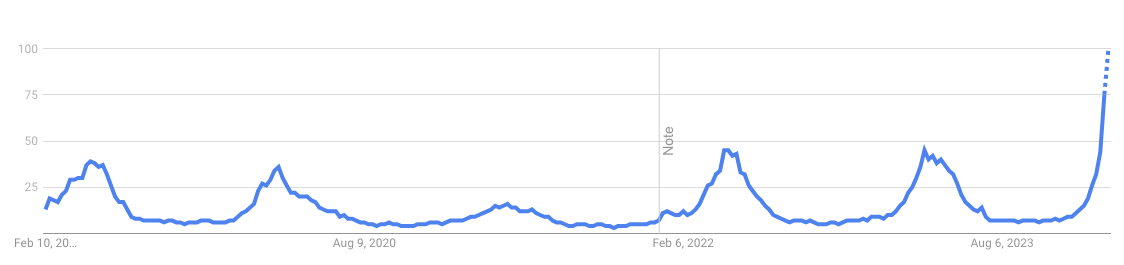
Weekly Google Trends index for keyword ‘dengue’ in Brazil, 2019 to 2024.
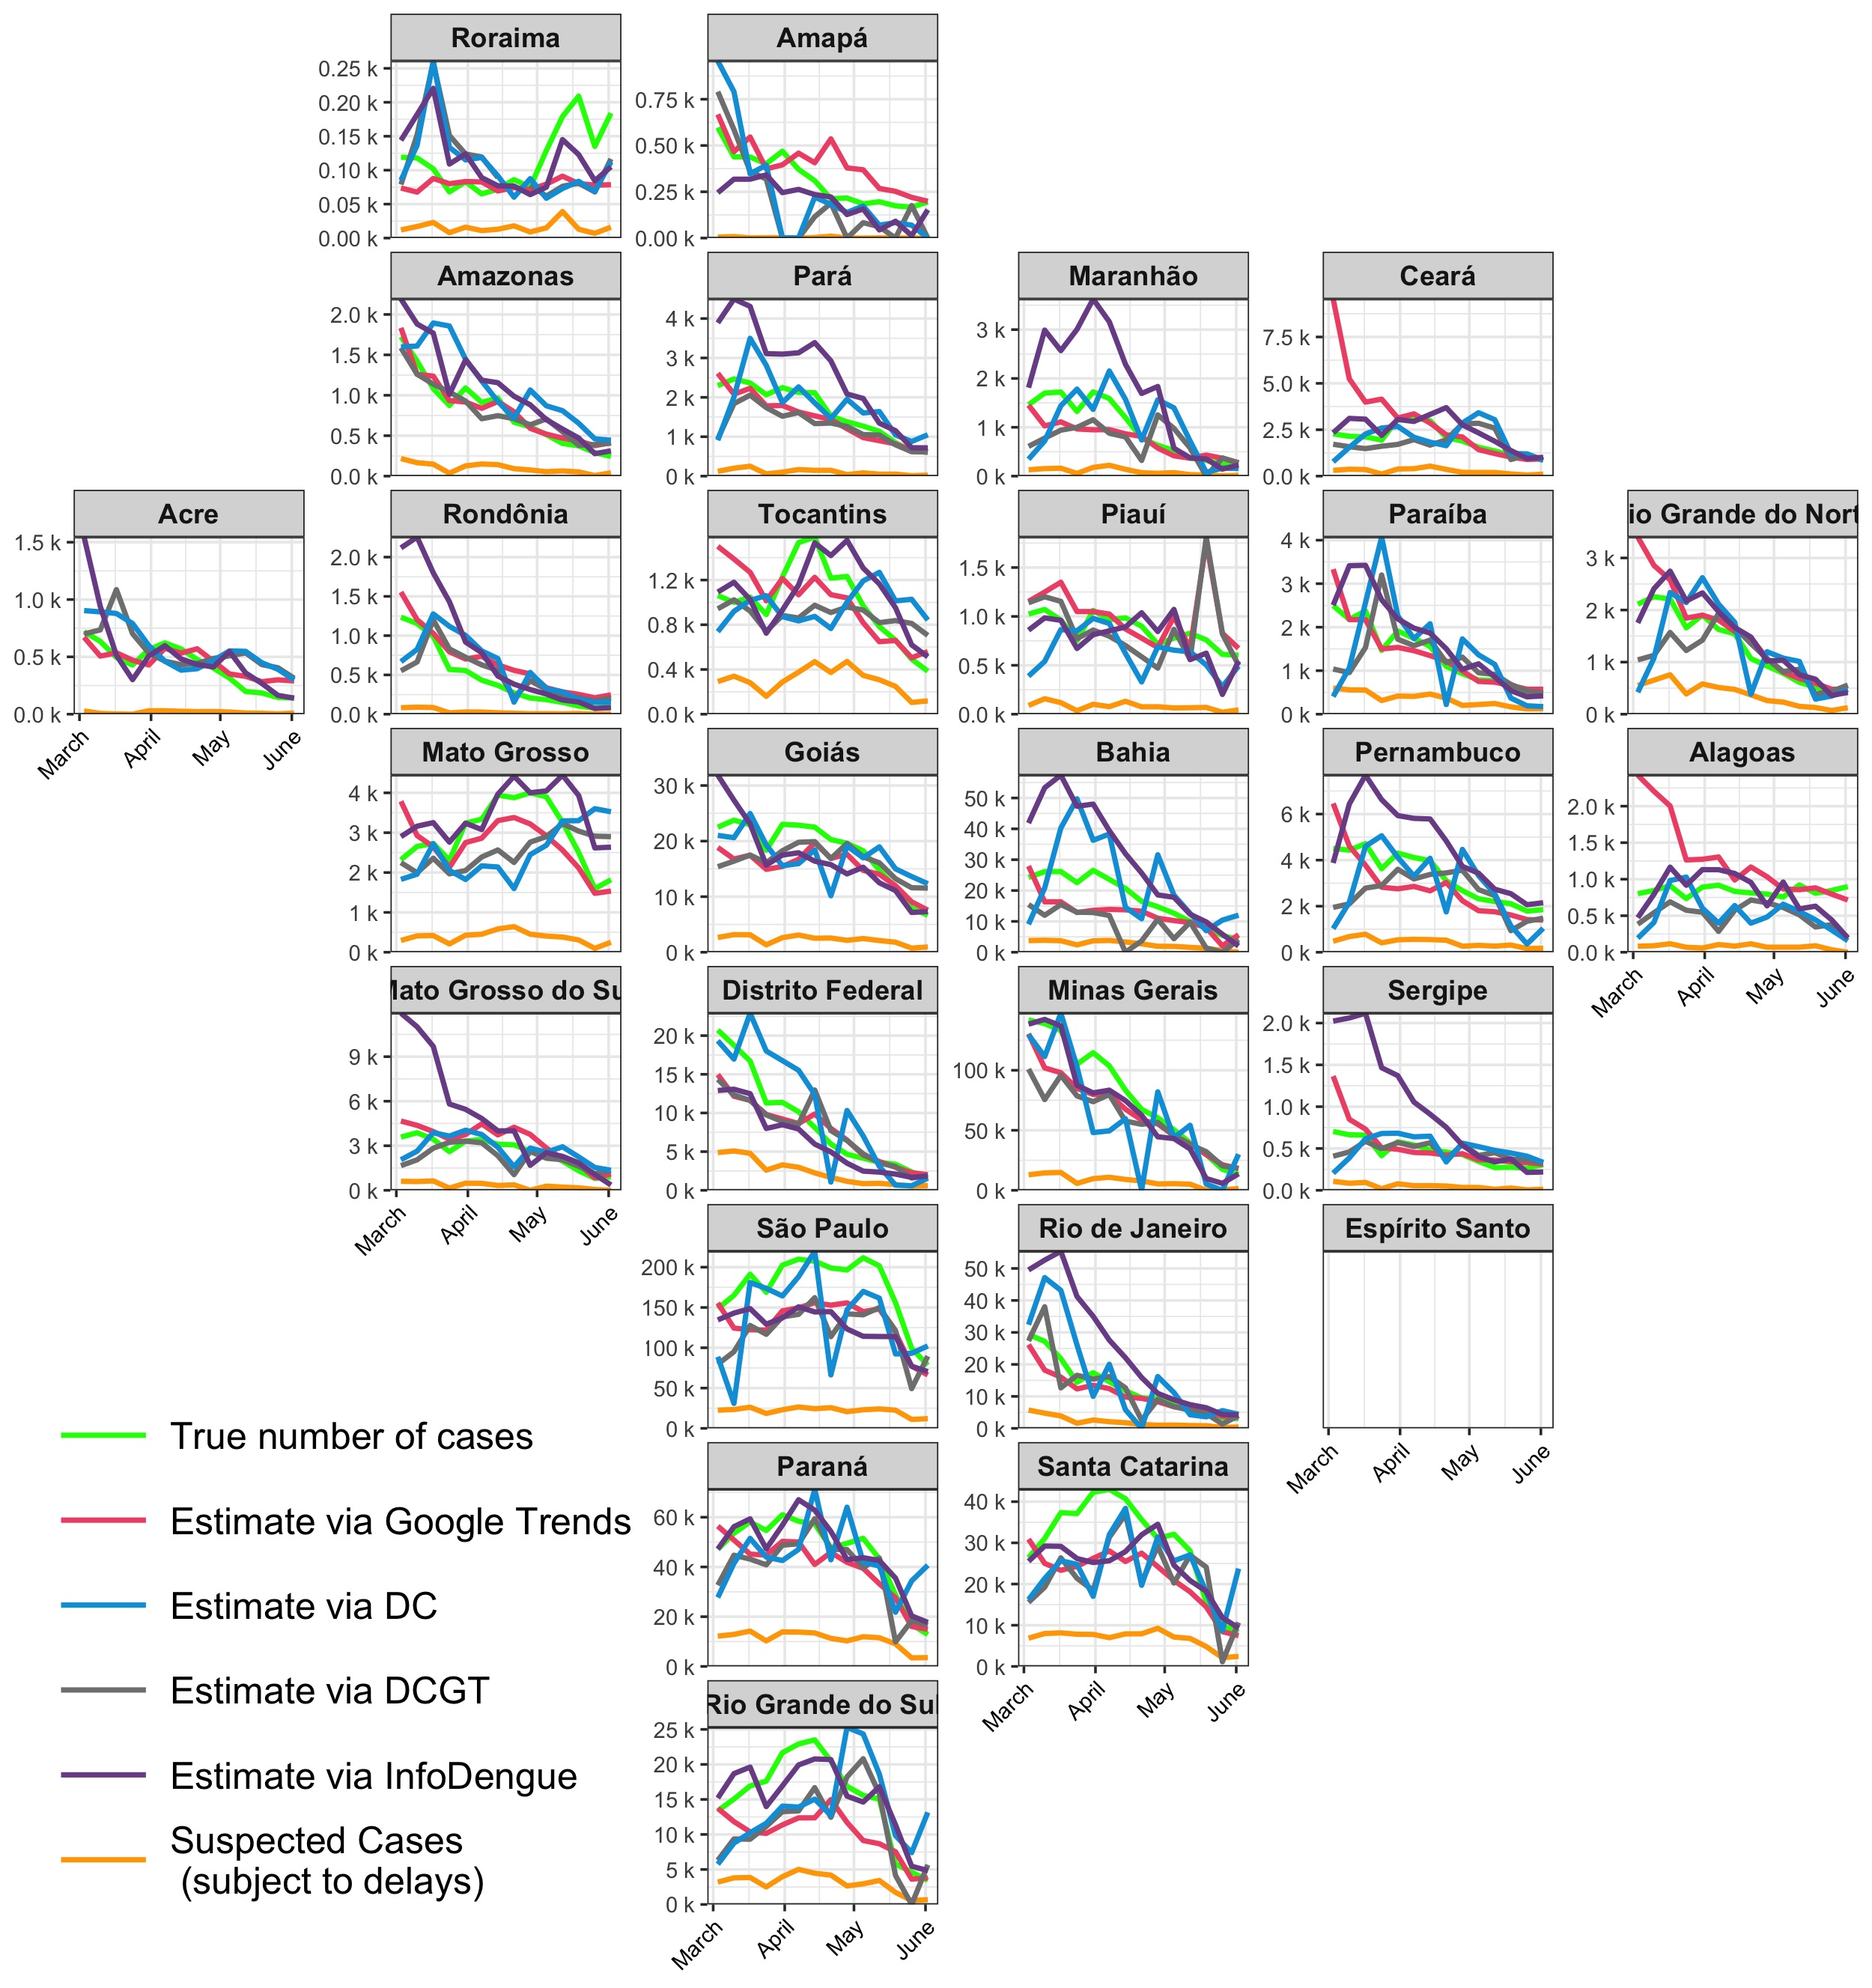
Dengue nowcasting in Brazil
We assessed the value of Google Trends for weekly dengue nowcasting in the 27 Brazilian states
Each week from March 2024 to January 2025:
- Download official number of dengue cases reported in InfoDengue and Google Trends indices
- Fit several nowcasting models using different information
- Performance evaluated comparing nowcasts with the actual cases (cases reported after 15 weeks) using error and uncertainty measures
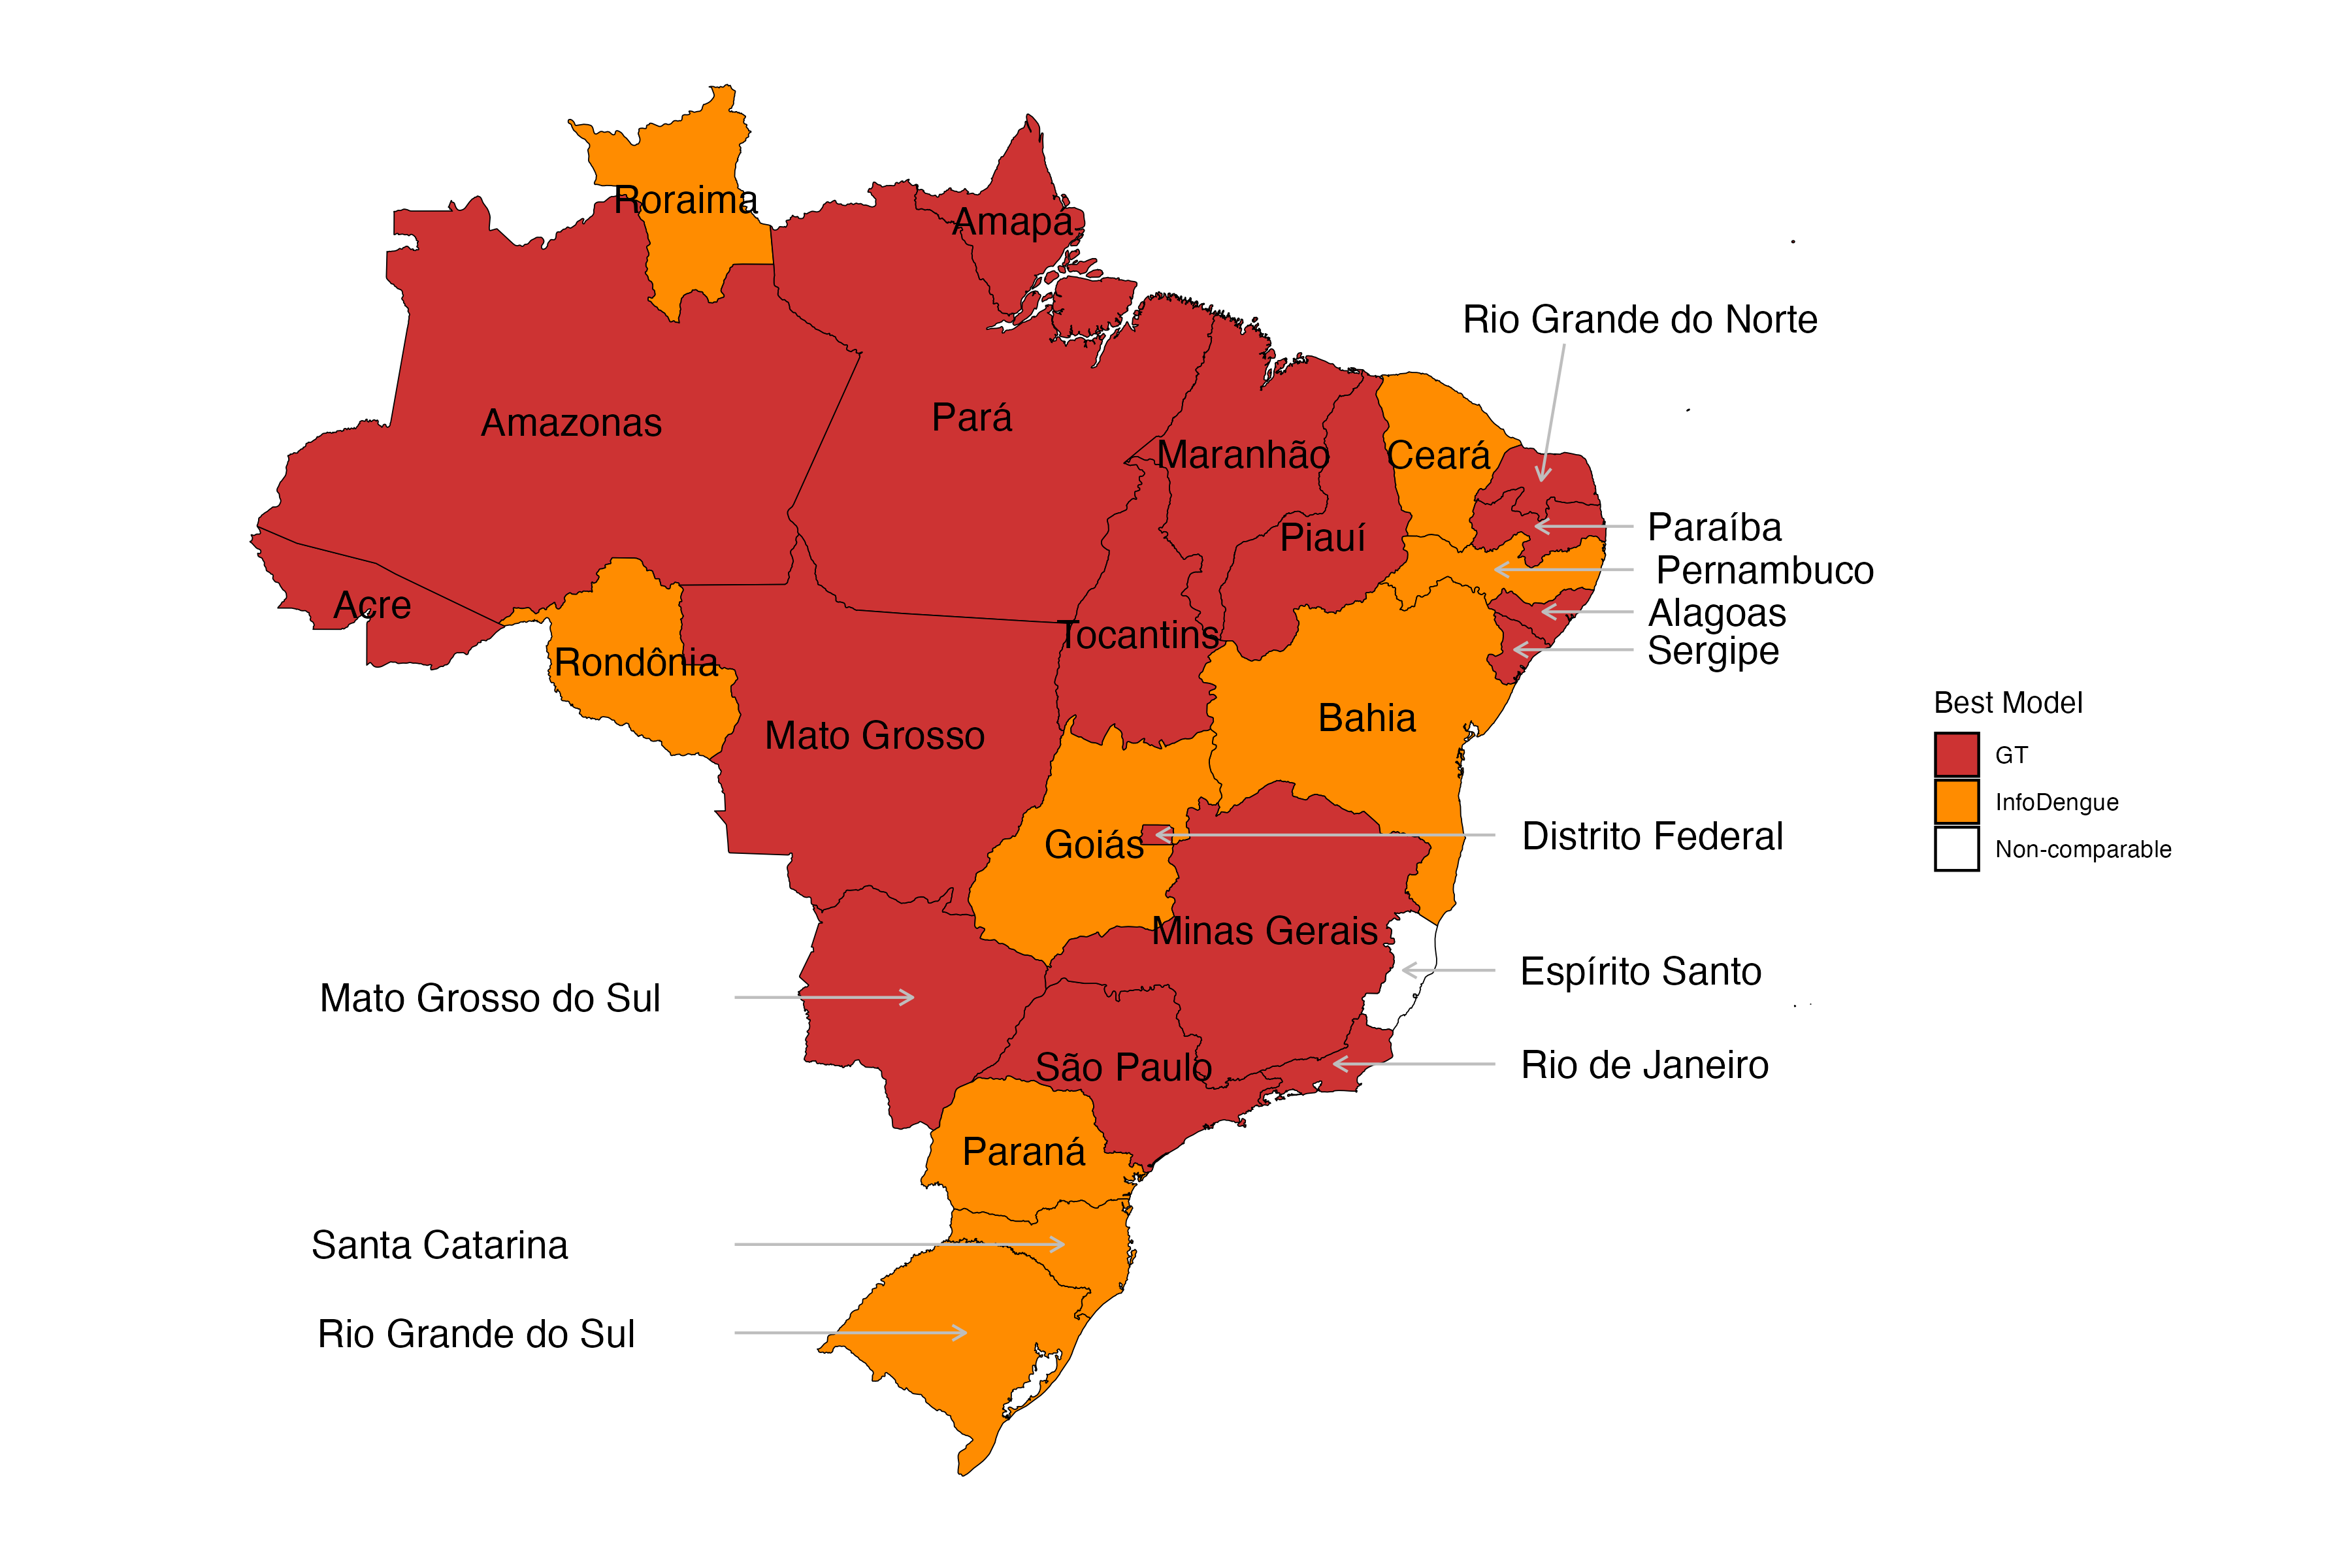
Results
Results vary by state. In general, Google Trends and joint model for reported cases and delay distribution by InfoDengue are the best-performing approaches
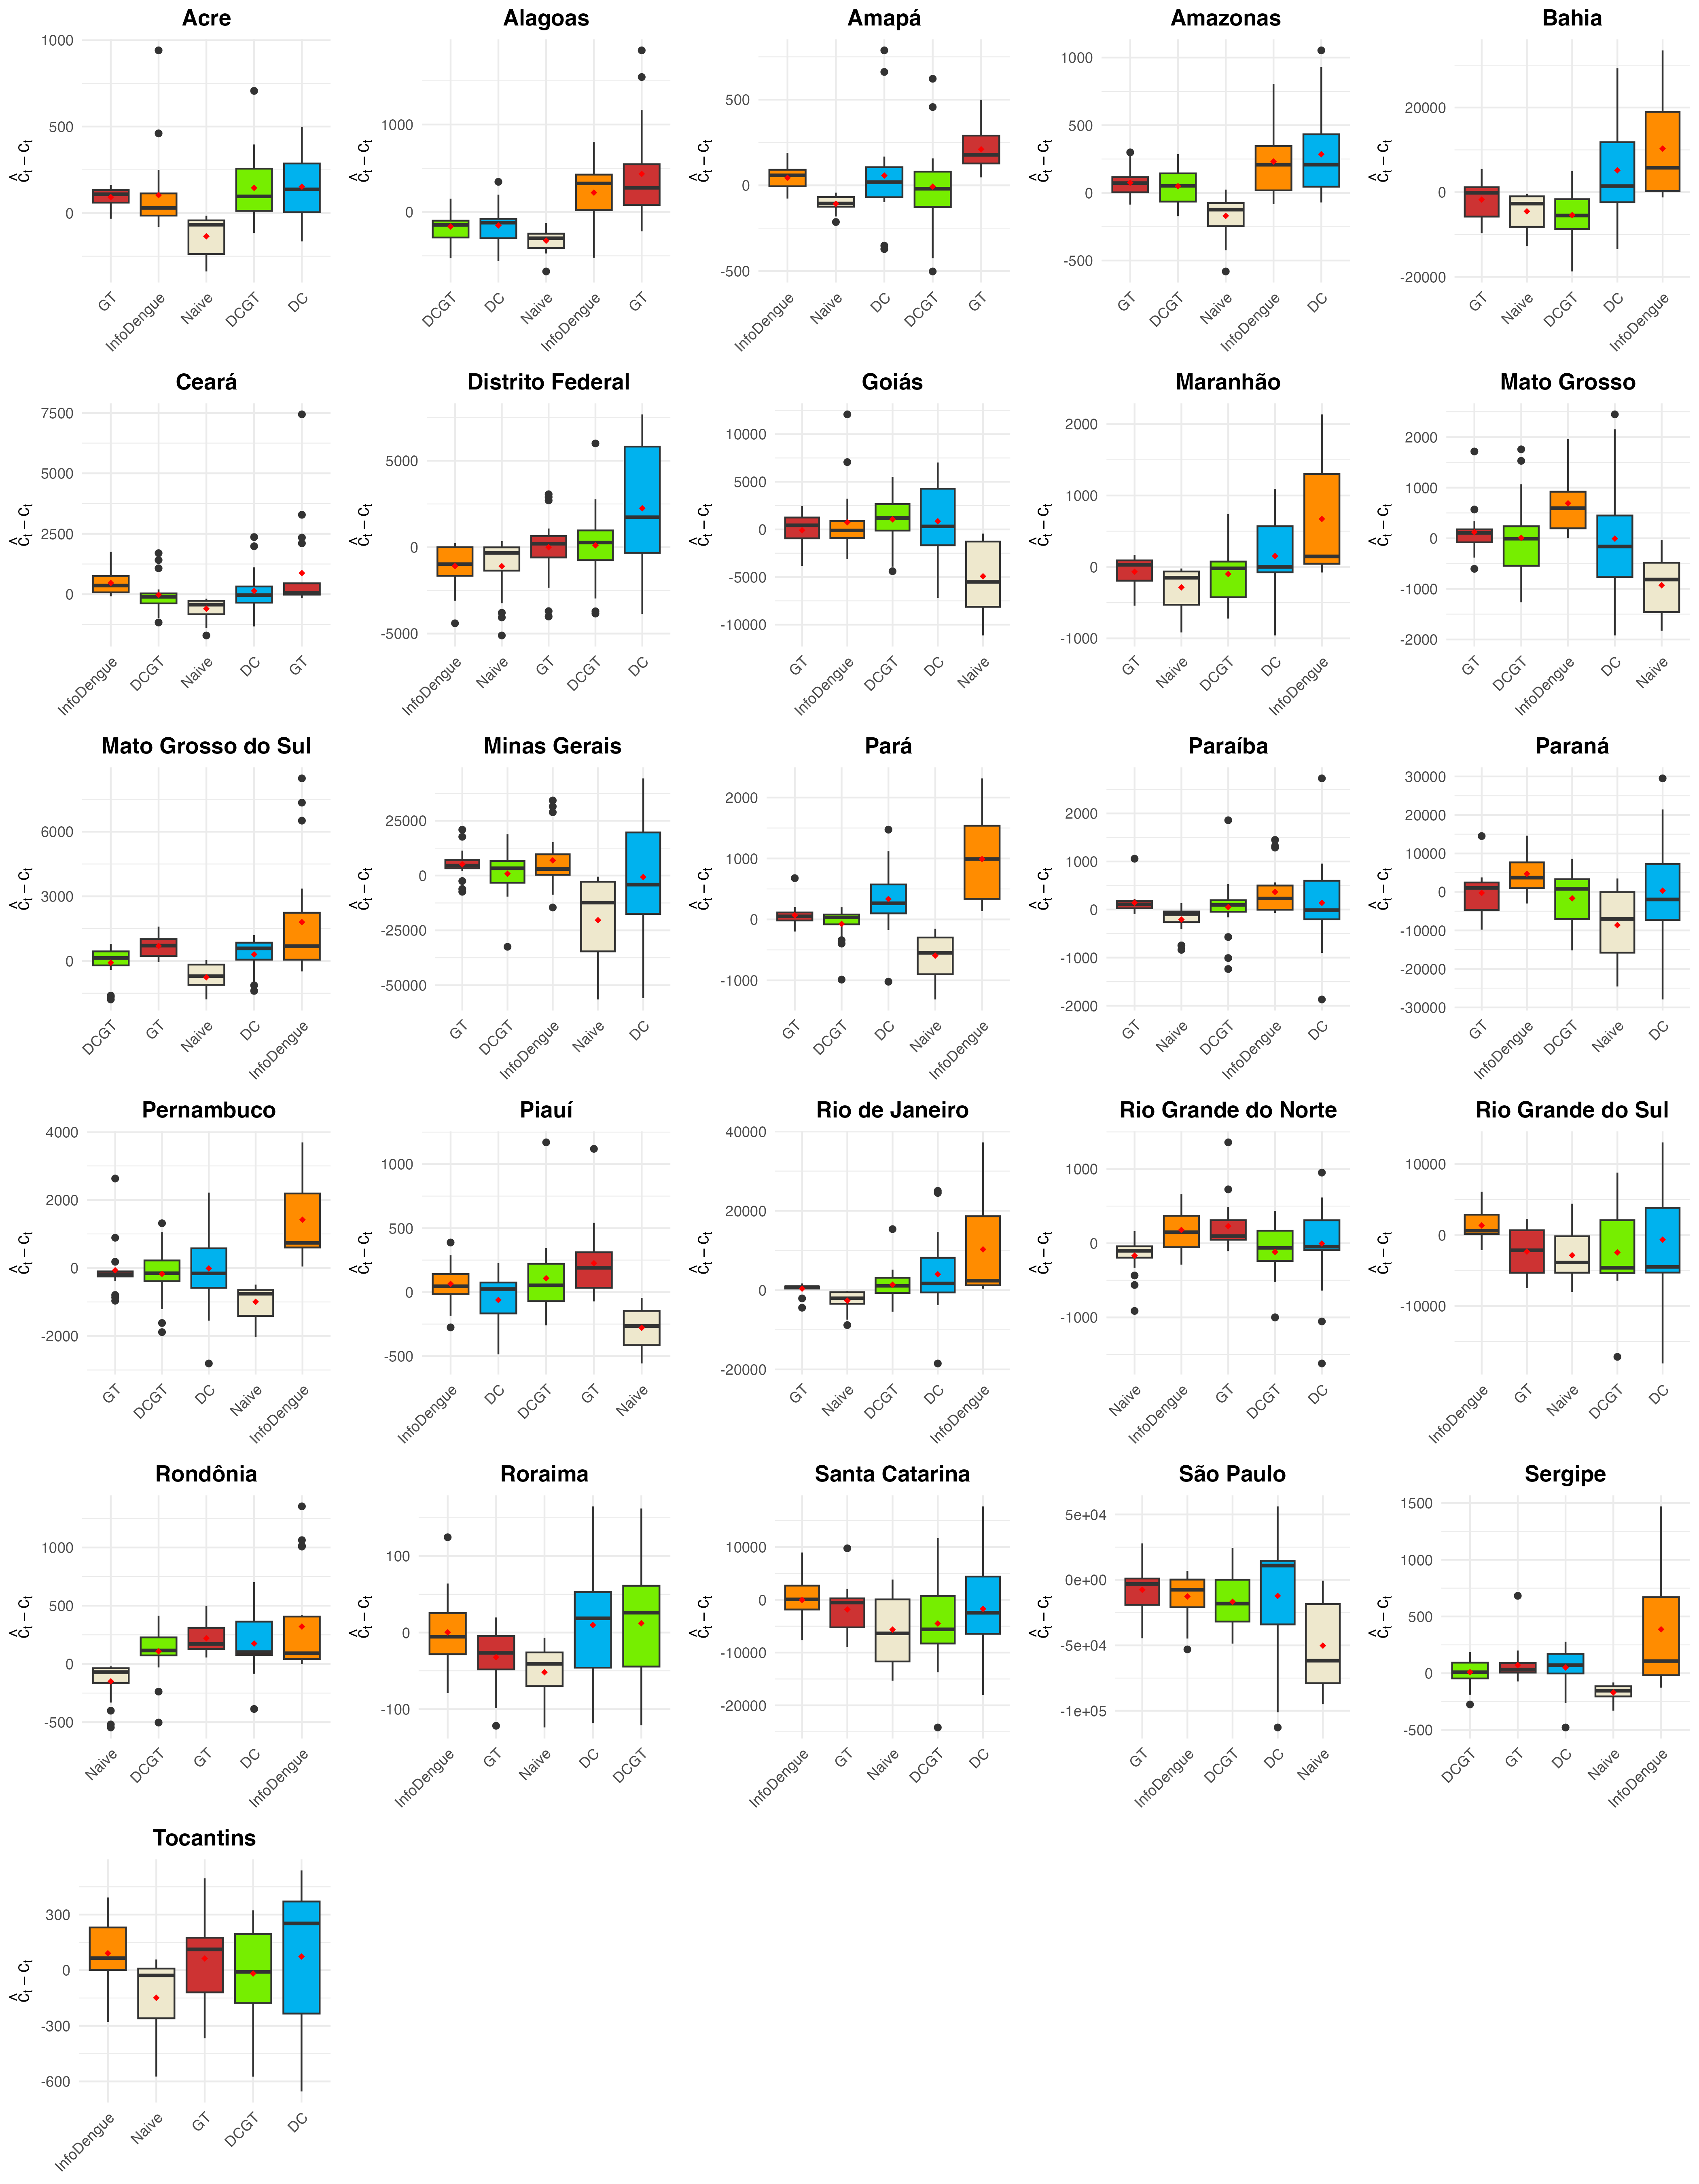
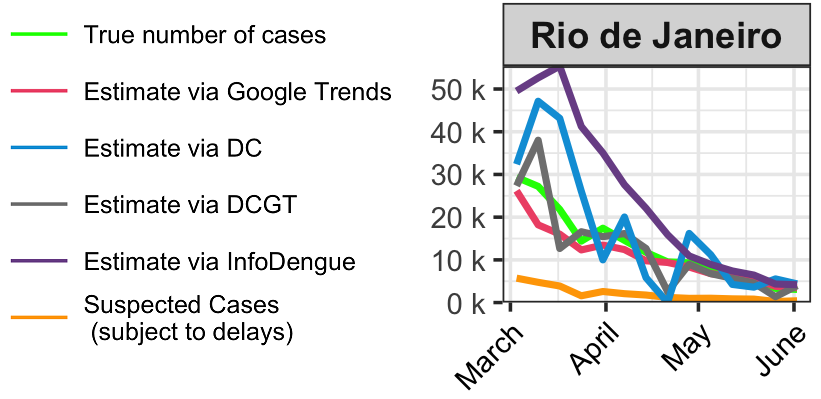
Weekly dengue nowcasts March to June, 2024
Weekly dengue nowcasts in Rio de Janeiro, March to June, 2024
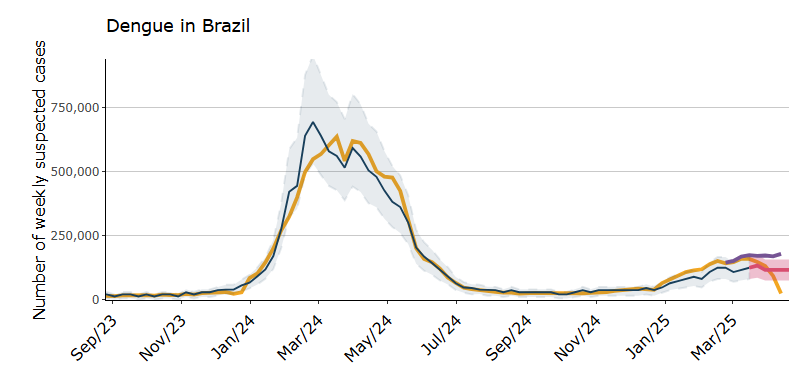
Dengue tracker in Brazil
Dengue-tracker provides weekly updates on the number of dengue cases per state in Brazil
We present official and corrected case counts incorporating information from Google Trends
Reports assist policymakers
and the general public in understanding dengue levels
and guide their decisions
![]()
Dengue tracker in Brazil
Dengue tracker in Brazil
Conclusions
We demonstrated the value of Google Trends data for dengue surveillance during Brazil’s 2024 dengue epidemic
Further research is needed to understand the use of digital data for disease information (e.g., ChatGPT)
Need to understand biases in digital data (not all individuals use search engines, just more educated and younger, internet penetration not same in all regions)
This study highlights the need for multiple, complementary data sources rather than a single data source for disease surveillance, especially during disease outbreaks
![]()
Disease forecasting
Nowcasting methods allow us to understand current disease activity levels and make better informed decisions
It is also important to predict the number of cases that will occur in the future so we have more time to be prepared and reduce disease impacts
During the 2024 epidemic, the Brazilian Ministry of Health requested 2025 dengue predictions to help inform their response and surveillance activities
Disease forecasting
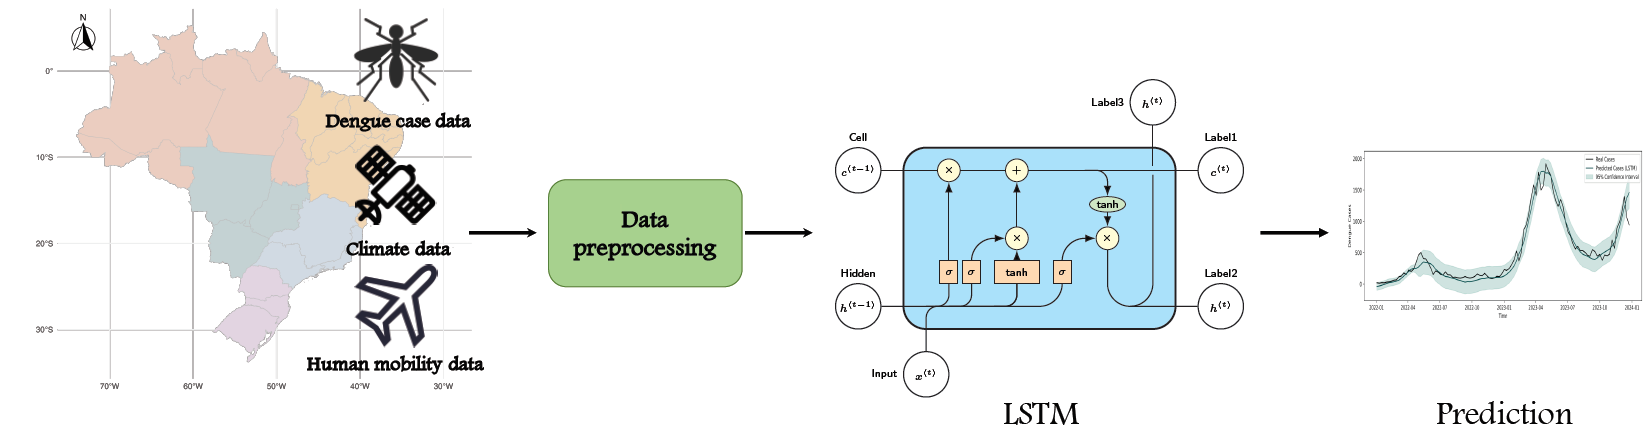
We developed a neural network model for dengue forecasting. The model accounts for complex delayed and non-linear effects of climate variables, and spatial information to obtain improved predictions of future dengue cases
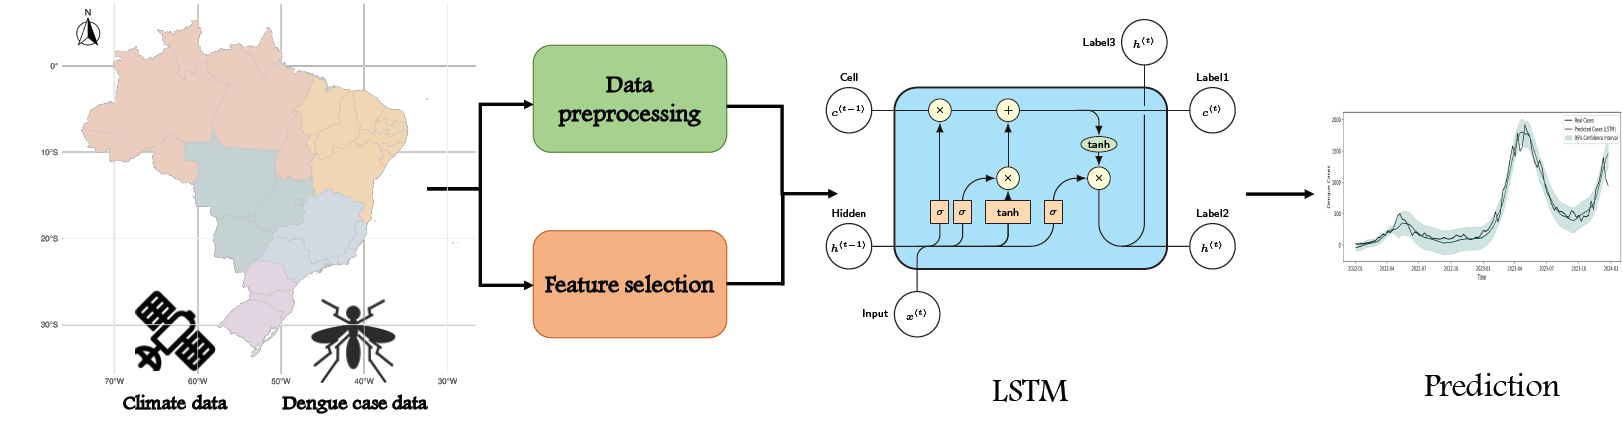
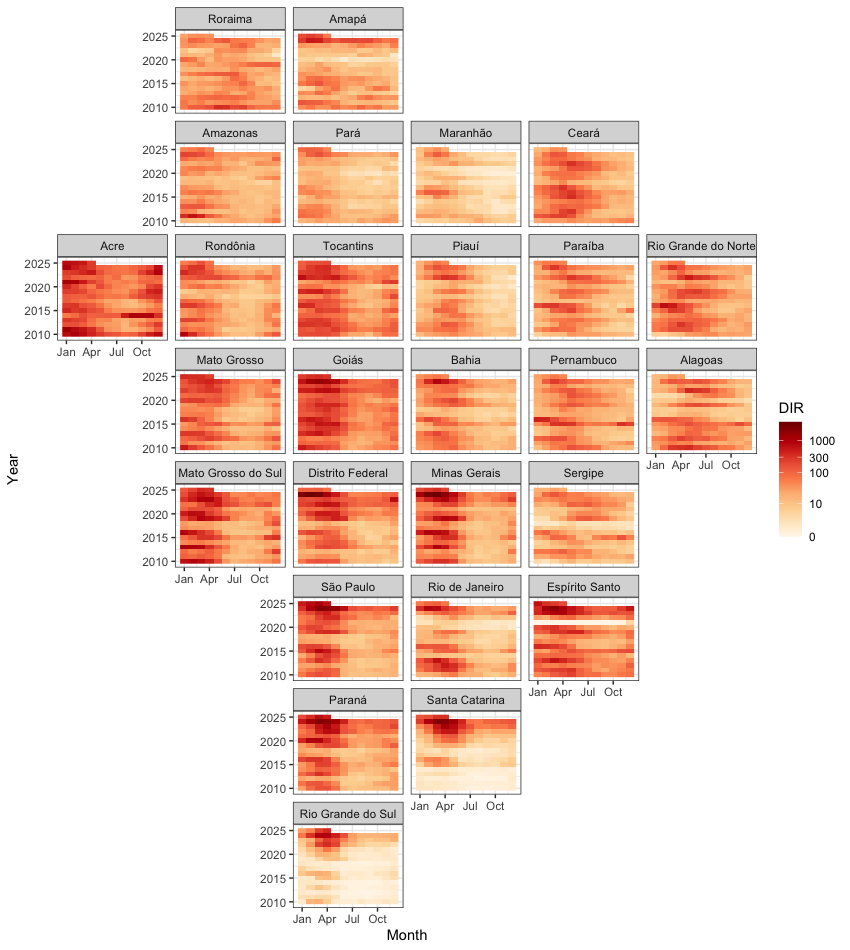
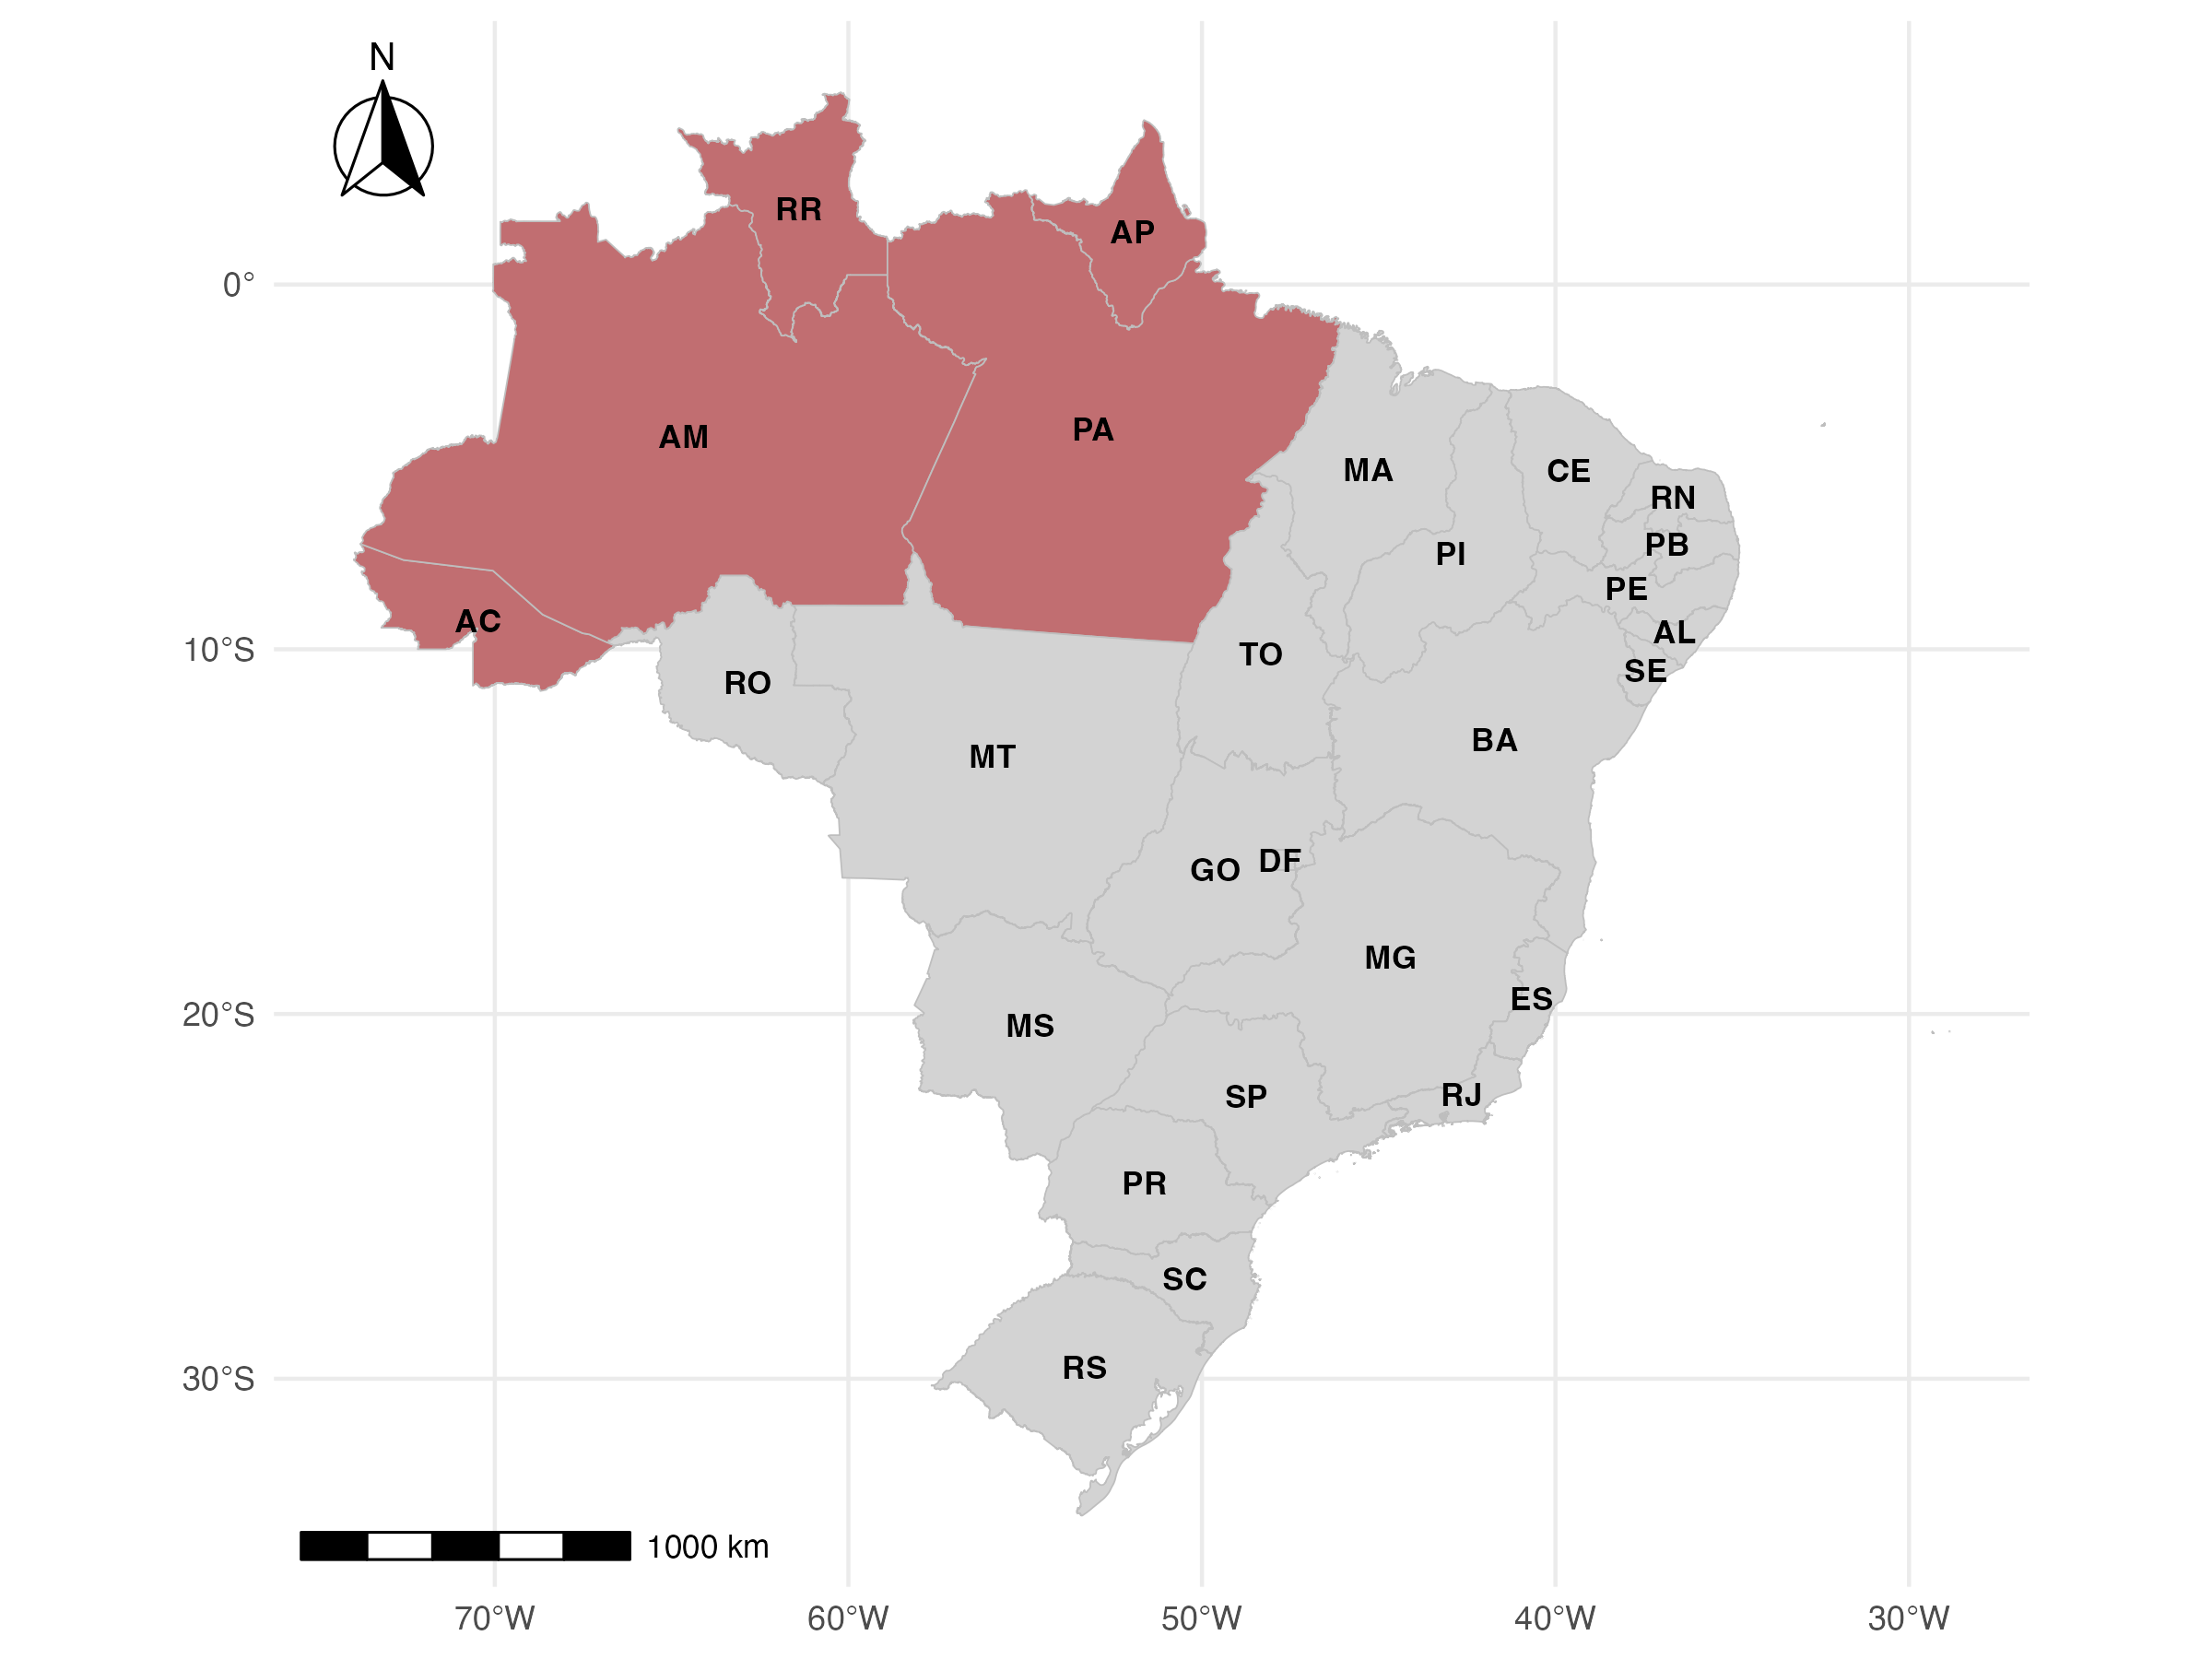
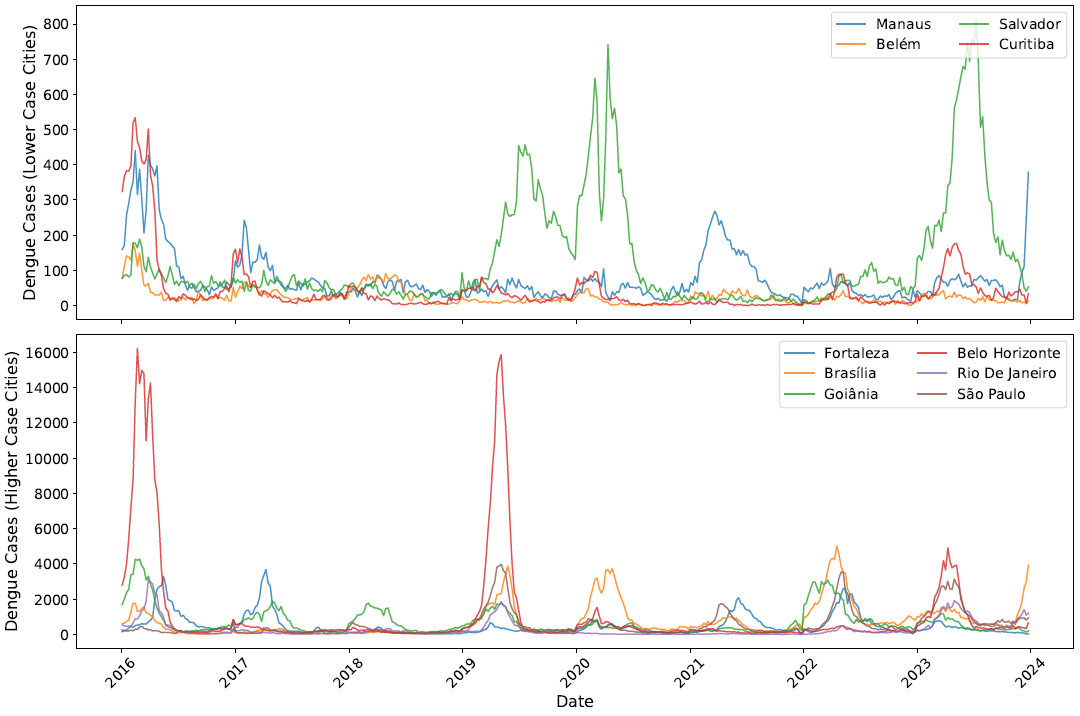
Weekly dengue incidence rate (cases per 100K) in 27 Brazilian states
Climate covariates
Dengue forecasting methods improve their accuracy by including risk factors such as climate and environmental variables known to affect transmission
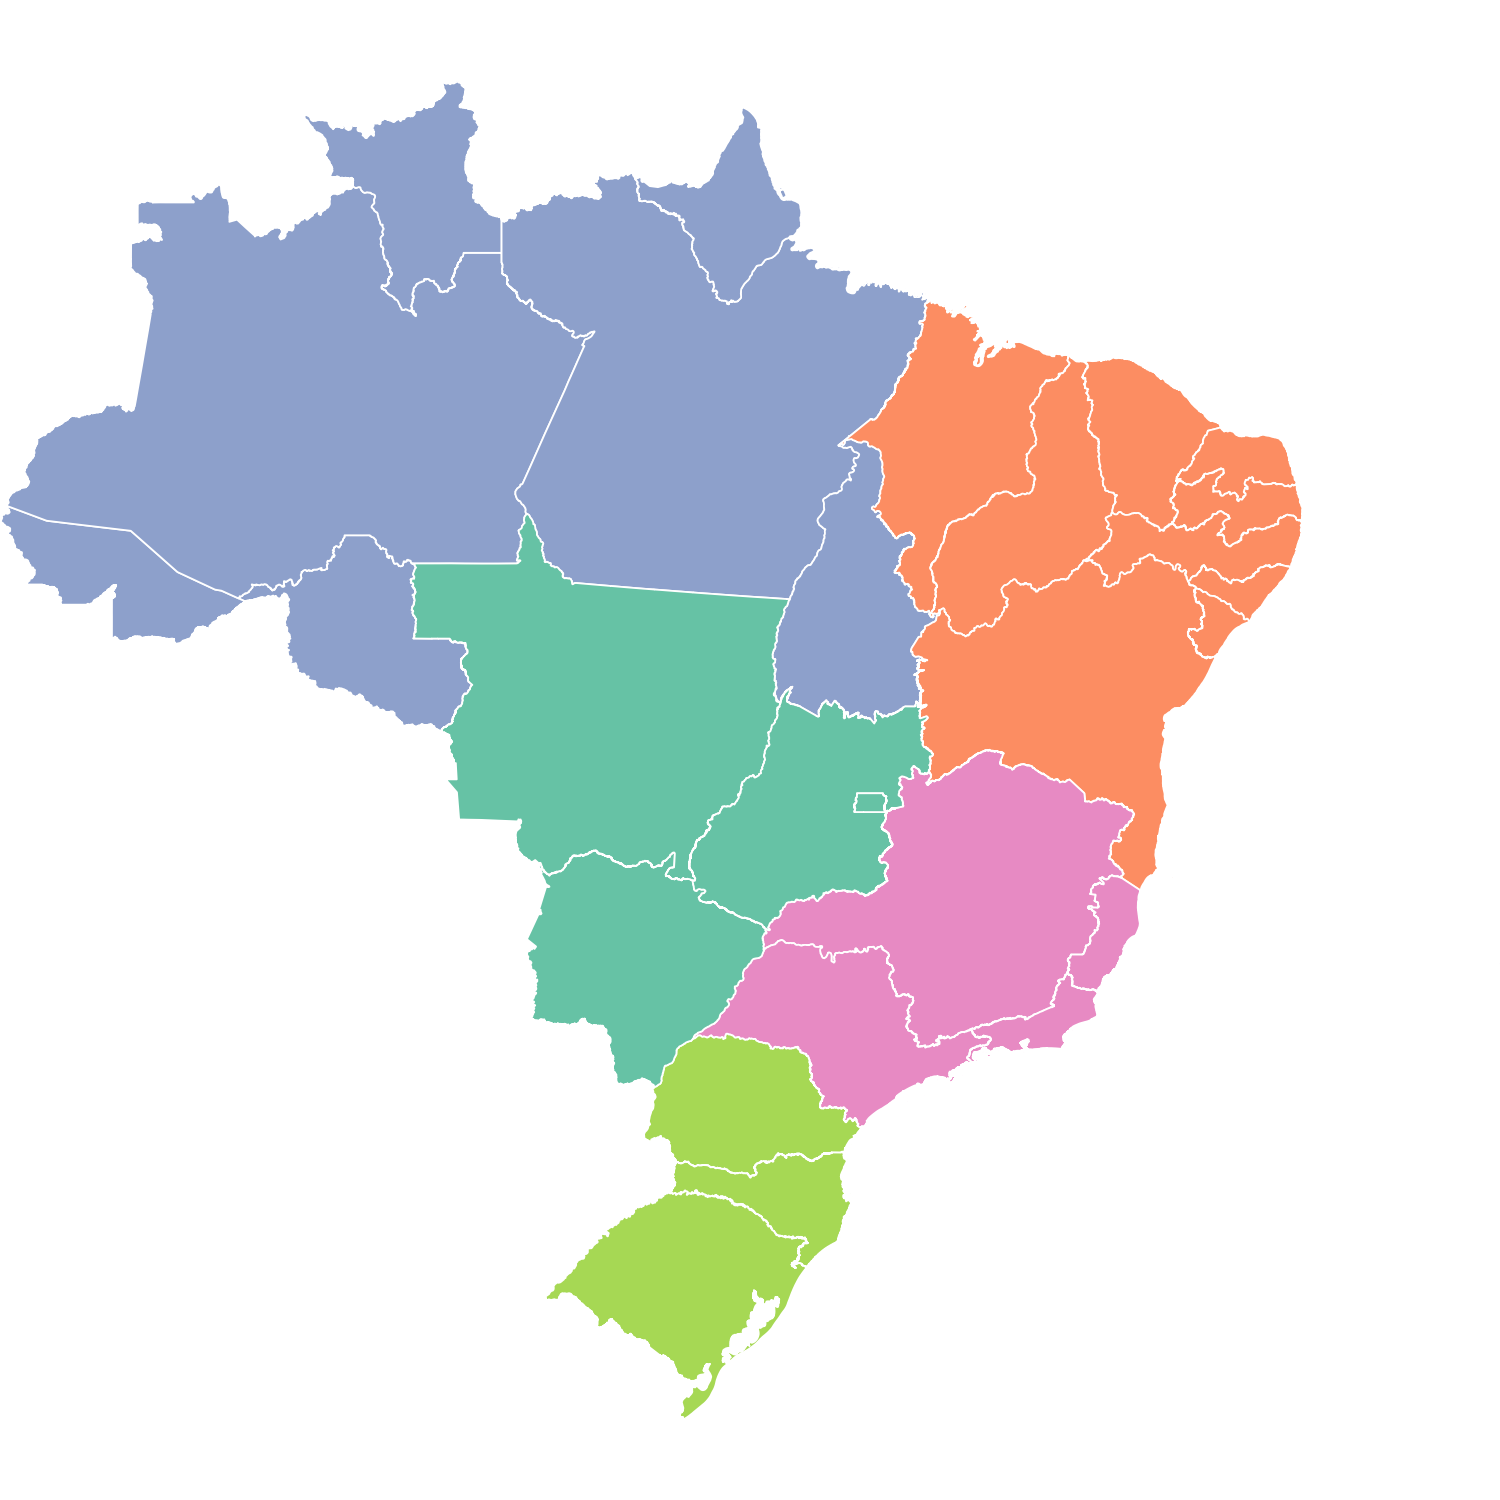
Borrowing information from neighbors
Neighbors assumed to be regions sharing a common boundary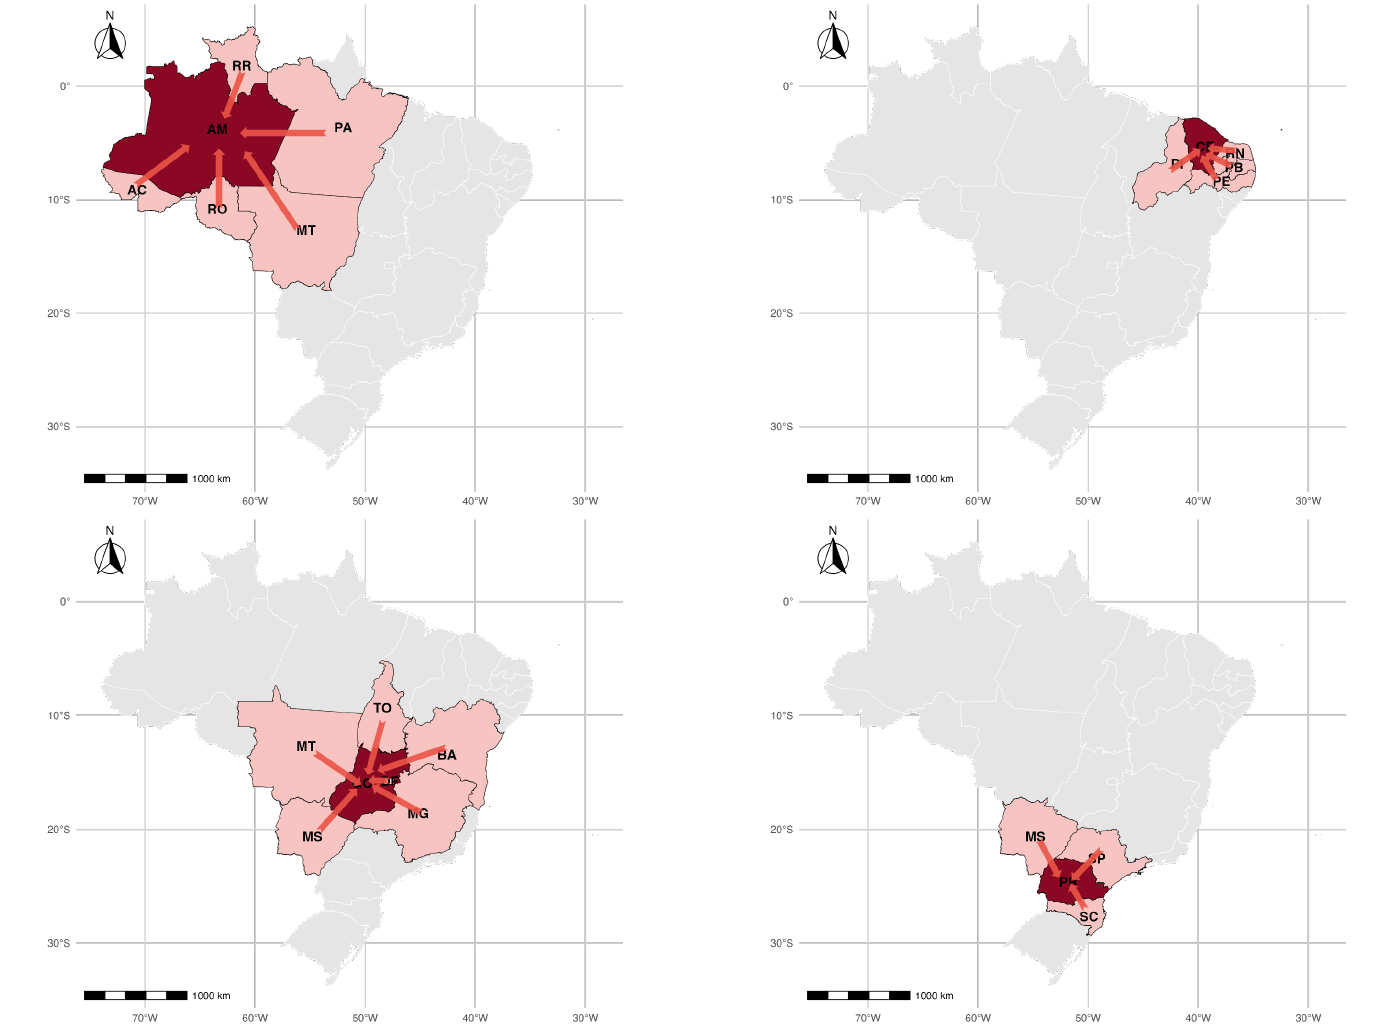
Goias: Tocantins, Bahia, Minas Gerais, Mato Grosso, Mato Grosso do Sul and Distrito Federal
Model’s performance assessment
We use the first 6 years to train the model and predict the number of dengue cases 1, 2, 3, 4, 8 and 12 weeks ahead. Then, we move the window one week keeping 6 years for training to predict the number of cases weeks ahead
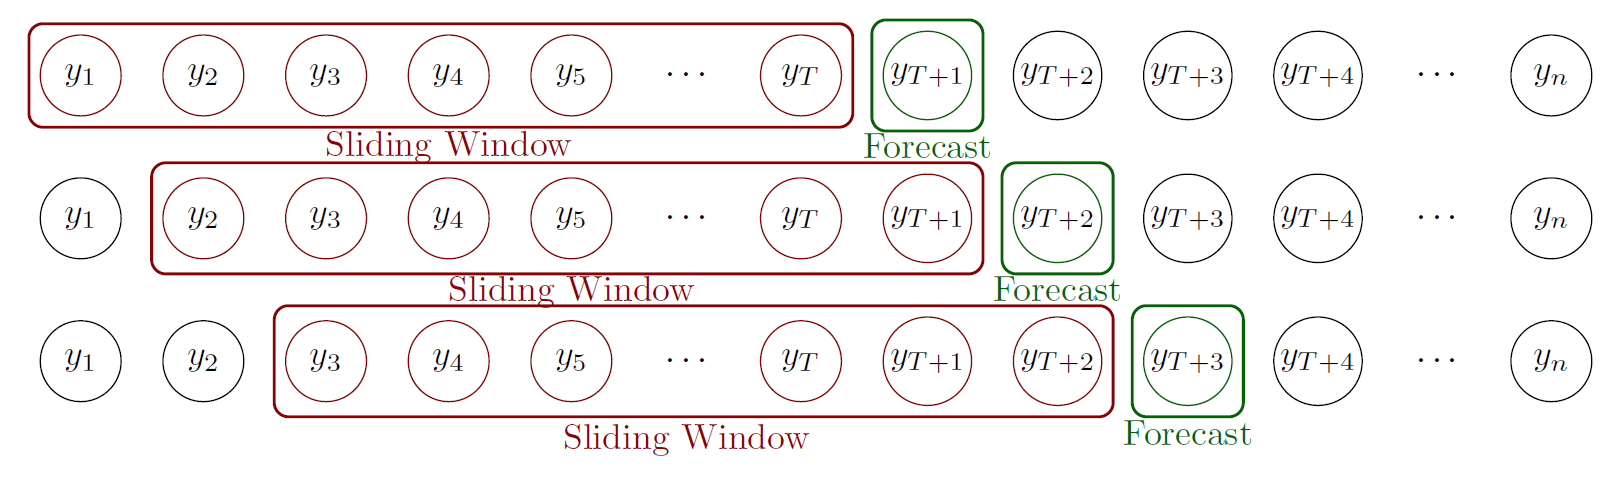
We assessed the model’s performance using error and uncertainty measures in comparison with other approaches that only use cases or climate information
Results
Model proposed performs well overall except northern states. These are regions in the Amazon which are less connected with their neighbors
Performance measures forecasts 4-weeks ahead
| Federal Unit (FU) | Code | LSTM-Cases | LSTM-Climate | LSTM-Climate-Spatial | Bayesian Baseline | ||||||||
|---|---|---|---|---|---|---|---|---|---|---|---|---|---|
| MAE | MAPE | CRPS | MAE | MAPE | CRPS | MAE | MAPE | CRPS | MAE | MAPE | CRPS | ||
| Acre (AC) | 12 | 305.19 | 45.50% | 90.91 | 129.76 | 22.30% | 35.68 | 136.83 | 24.89% | 37.34 | 382.77 | 47.23% | 96.13 |
| Alagoas (AL) | 27 | 177.96 | 43.29% | 38.14 | 79.24 | 30.54% | 16.27 | 61.08 | 23.17% | 12.98 | 69.39 | 24.28% | 13.41 |
| Amapá (AP) | 16 | 51.21 | 47.90% | 34.05 | 22.45 | 23.49% | 5.35 | 27.45 | 26.98% | 6.02 | 30.53 | 34.09% | 7.12 |
| Amazonas (AM) | 13 | 188.17 | 41.56% | 32.14 | 100.21 | 19.63% | 19.23 | 111.60 | 21.64% | 22.44 | 143.57 | 28.79% | 31.40 |
| Bahia (BA) | 29 | 886.64 | 29.94% | 165.30 | 639.44 | 23.20% | 123.86 | 532.46 | 17.13% | 120.50 | 718.63 | 22.84% | 137.74 |
| Ceará (CE) | 23 | 562.67 | 46.52% | 108.09 | 245.17 | 27.54% | 52.99 | 187.56 | 15.51% | 35.01 | 315.69 | 30.16% | 60.26 |
| Distrito Federal (DF) | 53 | 1040.21 | 26.69% | 244.60 | 926.73 | 23.24% | 219.97 | 767.30 | 16.72% | 211.70 | 997.42 | 24.57% | 249.25 |
| Espírito Santo (ES) | 32 | 8431.94 | 30.90% | 1713.56 | 7262.14 | 30.35% | 1310.95 | 6300.78 | 23.06% | 1308.43 | 6967.74 | 25.93% | 1552.96 |
| Goiás (GO) | 52 | 1708.00 | 30.34% | 310.44 | 1277.24 | 27.36% | 226.00 | 1195.70 | 19.87% | 222.87 | 1722.08 | 29.75% | 321.36 |
| Maranhão (MA) | 21 | 143.59 | 56.31% | 26.44 | 102.87 | 38.07% | 18.93 | 59.27 | 23.91% | 10.88 | 147.31 | 53.05% | 28.14 |
| Mato Grosso (MT) | 51 | 657.81 | 34.65% | 189.42 | 563.40 | 26.97% | 142.56 | 340.72 | 16.69% | 72.73 | 624.21 | 28.36% | 125.27 |
| Mato Grosso do Sul (MS) | 50 | 1711.05 | 75.23% | 342.47 | 568.10 | 59.97% | 108.71 | 404.48 | 40.11% | 81.94 | 1646.17 | 50.03% | 344.61 |
| Minas Gerais (MG) | 31 | 15099.46 | 52.28% | 3253.80 | 7730.47 | 33.33% | 1648.53 | 5088.71 | 24.52% | 1035.86 | 14220.67 | 40.19% | 3472.85 |
| Pará (PA) | 15 | 319.85 | 47.03% | 72.72 | 256.88 | 26.23% | 53.97 | 159.61 | 19.43% | 34.75 | 210.77 | 21.89% | 56.14 |
| Paraná (PR) | 41 | 651.62 | 44.56% | 145.98 | 532.44 | 26.62% | 104.80 | 391.02 | 20.01% | 81.55 | 603.78 | 22.63% | 117.92 |
| Pernambuco (PE) | 26 | 501.76 | 41.95% | 96.53 | 358.33 | 32.90% | 69.27 | 257.65 | 19.53% | 58.65 | 355.72 | 26.02% | 72.60 |
| Piauí (PI) | 22 | 319.75 | 43.87% | 57.96 | 263.10 | 30.81% | 50.76 | 194.54 | 20.75% | 41.58 | 298.91 | 28.17% | 57.16 |
| Rio de Janeiro (RJ) | 33 | 1034.84 | 32.60% | 217.36 | 861.35 | 25.10% | 194.52 | 717.22 | 18.02% | 175.08 | 910.87 | 22.58% | 210.46 |
| Rio Grande do Norte (RN) | 24 | 313.87 | 49.58% | 68.70 | 252.68 | 30.67% | 47.31 | 171.49 | 19.76% | 35.35 | 259.23 | 24.48% | 49.58 |
| Rio Grande do Sul (RS) | 43 | 823.57 | 31.88% | 155.09 | 679.61 | 28.42% | 122.36 | 548.03 | 21.42% | 98.53 | 736.82 | 25.74% | 149.61 |
| Rondônia (RO) | 11 | 371.50 | 79.49% | 103.44 | 300.93 | 42.08% | 79.71 | 285.61 | 40.93% | 69.17 | 323.33 | 43.03% | 104.34 |
| Roraima (RR) | 14 | 9.33 | 40.63% | 6.03 | 6.52 | 43.27% | 5.02 | 6.36 | 44.31% | 5.93 | 8.66 | 52.55% | 2.55 |
| Santa Catarina (SC) | 42 | 7381.10 | 79.16% | 1765.31 | 1585.71 | 56.28% | 395.28 | 1556.58 | 15.21% | 294.09 | 3028.00 | 40.68% | 831.25 |
| São Paulo (SP) | 35 | 9544.39 | 49.61% | 2196.34 | 4088.67 | 31.97% | 921.95 | 3068.46 | 17.28% | 612.34 | 8468.53 | 31.64% | 1961.50 |
| Sergipe (SE) | 28 | 54.35 | 20.82% | 13.07 | 45.92 | 17.48% | 9.43 | 41.52 | 16.50% | 8.11 | 86.08 | 31.38% | 18.57 |
| Tocantins (TO) | 17 | 124.25 | 49.07% | 31.51 | 103.21 | 37.89% | 28.46 | 92.55 | 29.12% | 20.44 | 128.97 | 45.07% | 27.20 |
Mobility
To tackle this, instead of assuming connectivity between adjacent regions, we assumed connectivity if there were people traveling between regions
Consider dataset on mobility spanning air, road, and waterway transport (Oliveira et al., The Lancet Digital Health, 2024)
Spatial modeling including mobility data
Consider contribution of cases imported into each city \(i\) from others in week \(t\): \[ \text{Imported Cases}_{i, t} = \sum_{j \in \mathcal{N}_i} \text{Mobility}_{ji} \cdot \frac{\text{Cases}_{j, t}}{\text{Population}_j} \]
\(\mathcal{N}_i\): set of cities with connections with city \(i\), \(\text{Mobility}_{ji}\): people from city \(j\) to \(i\), \(\text{Cases}_{j, t}\): number cases in city \(j\) and week \(t\), \(\text{Population}_j\) city \(j\)
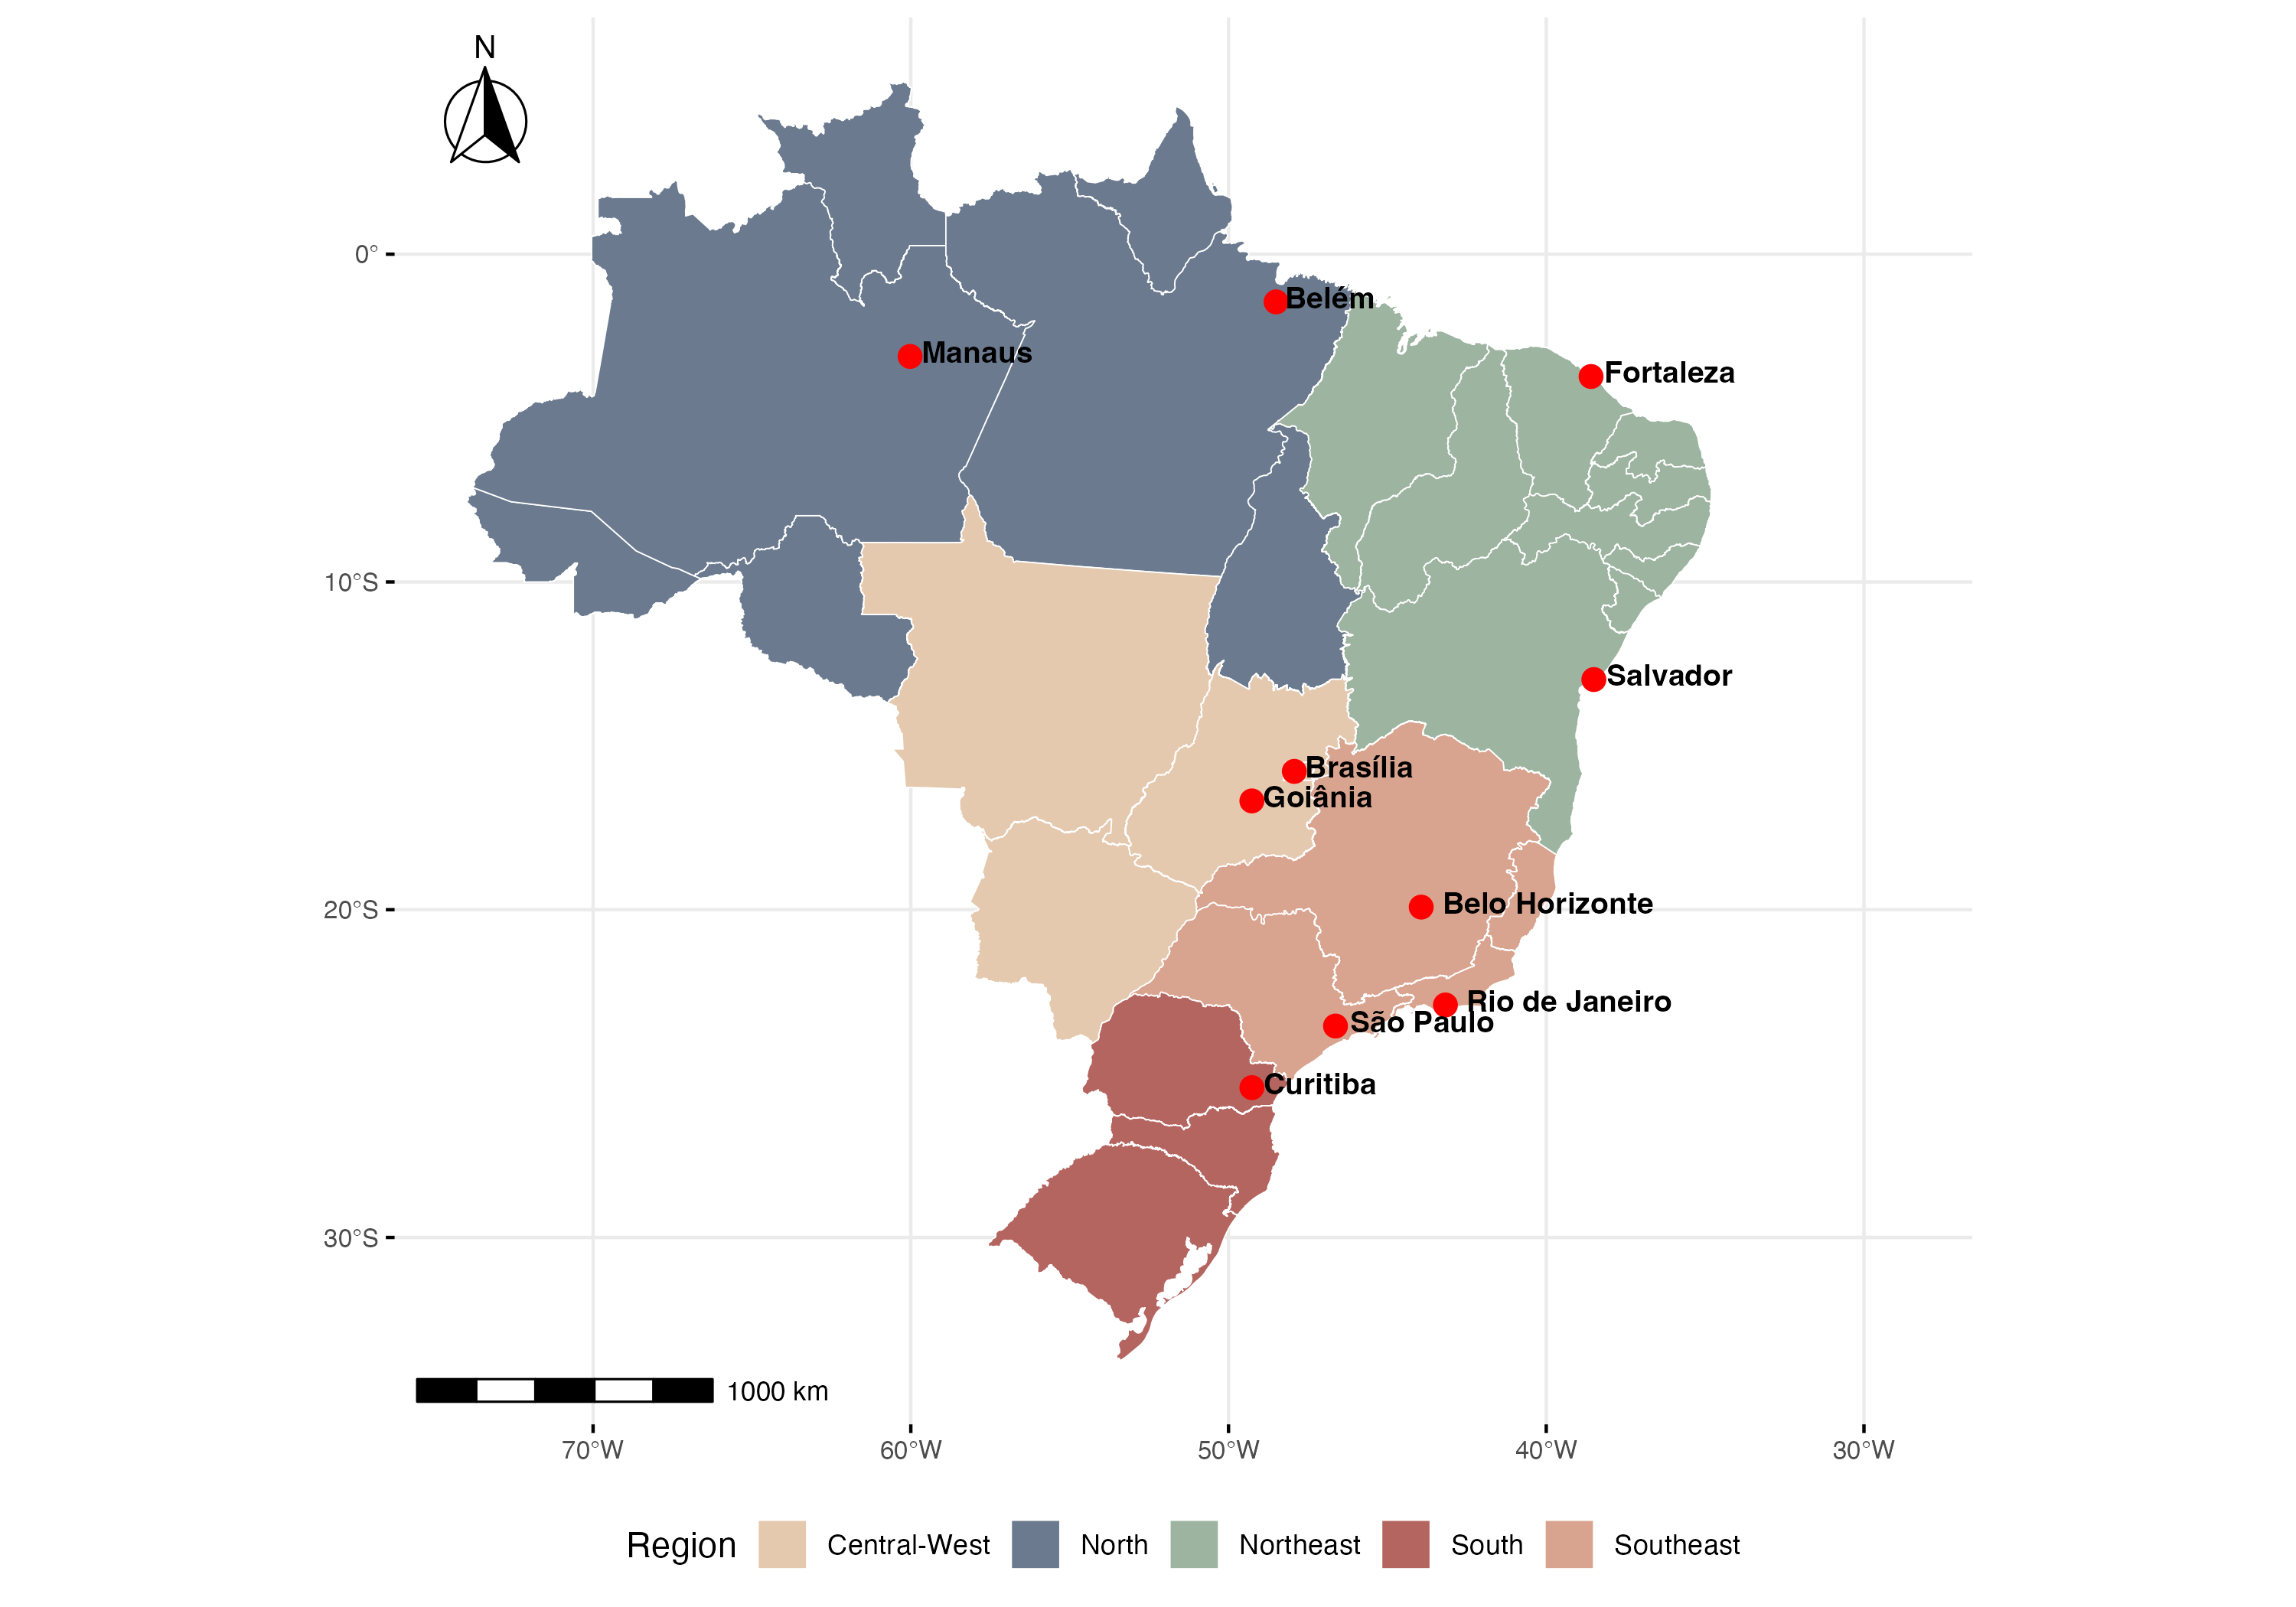
Results
We assessed the performance of the improved model in selected cities representing different climatic zones and disease dynamics profiles. Results demonstrate the incorporation of human movement patterns improves prediction compared with models that use spatial adjacency structures
|
|
Chen and Moraga, Infectious Disease Modelling, 2025
Conclusions
- Developed a forecasting model integrating cases, climate and mobility
- Model is generalizable and can be applied to forecast other diseases influenced by climate and mobility in other settings
- Findings in open access papers, code publicly available for reproducibility
Forecasting 2025 dengue cases in Brazil
Brazilian Ministry of Health requested 2025 dengue predictions to help inform their response and surveillance activities
We participated in the Infodengue-Mosqlimate Dengue Challenge (IMDC) to produce actionable forecasts of the 2025 dengue season

Ensemble forecast for dengue in Brazil, 2025
Predictions for the states of Amazonas (AM), Ceará (CE), Goiás (GO), Paraná (PR), and Minas Gerais (MG)
Correa, …, Moraga, et al., Proceedings of the National Academy of Sciences (PNAS), 2026
Dengue forecasting challenge results
The results of the challenge published in September 2024 as a technical report in Portuguese ensuring it reached key decision-makers in Ministry of Health
Dengue forecasting challenge results
- Forecasting methods code and results publicly available for reproducibility
- We continue our collaboration working on better models to provide improved dengue projections to help inform prevention and control strategies by the Brazilian Ministry of Health
Spatio-temporal disease prediction integrating compartment and point process models
COVID-19 cases in Cali, Colombia, 2020
SIR model
Fit SIR (Susceptible, Infected, Recovered) compartment model to aggregated data for each time to predict the number of infectious individuals at each time

Number individuals in population \(S(t) + I(t) + R(t) = N\) constant
Disease parameters:
\(\beta > 0\) infectious rate
\(\gamma > 0\) recovery rate
\[\begin{align*} \frac{dS(t)}{dt} &= -\beta S(t) \frac{I(t)}{N} \\ \frac{dI(t)}{dt} &= +\beta S(t) \frac{I(t)}{N} - \gamma I(t) \\ \frac{dR(t)}{dt} &= +\gamma I(t) \end{align*}\]
SIR model could be extended to consider more compartments (e.g.,
\(I_S(t)\) symptomatic, \(I_A(t)\) asymptomatic)
Kermack and McKendrick, Proceedings of the Royal Society, 1927
SIR with age-stratified contact information
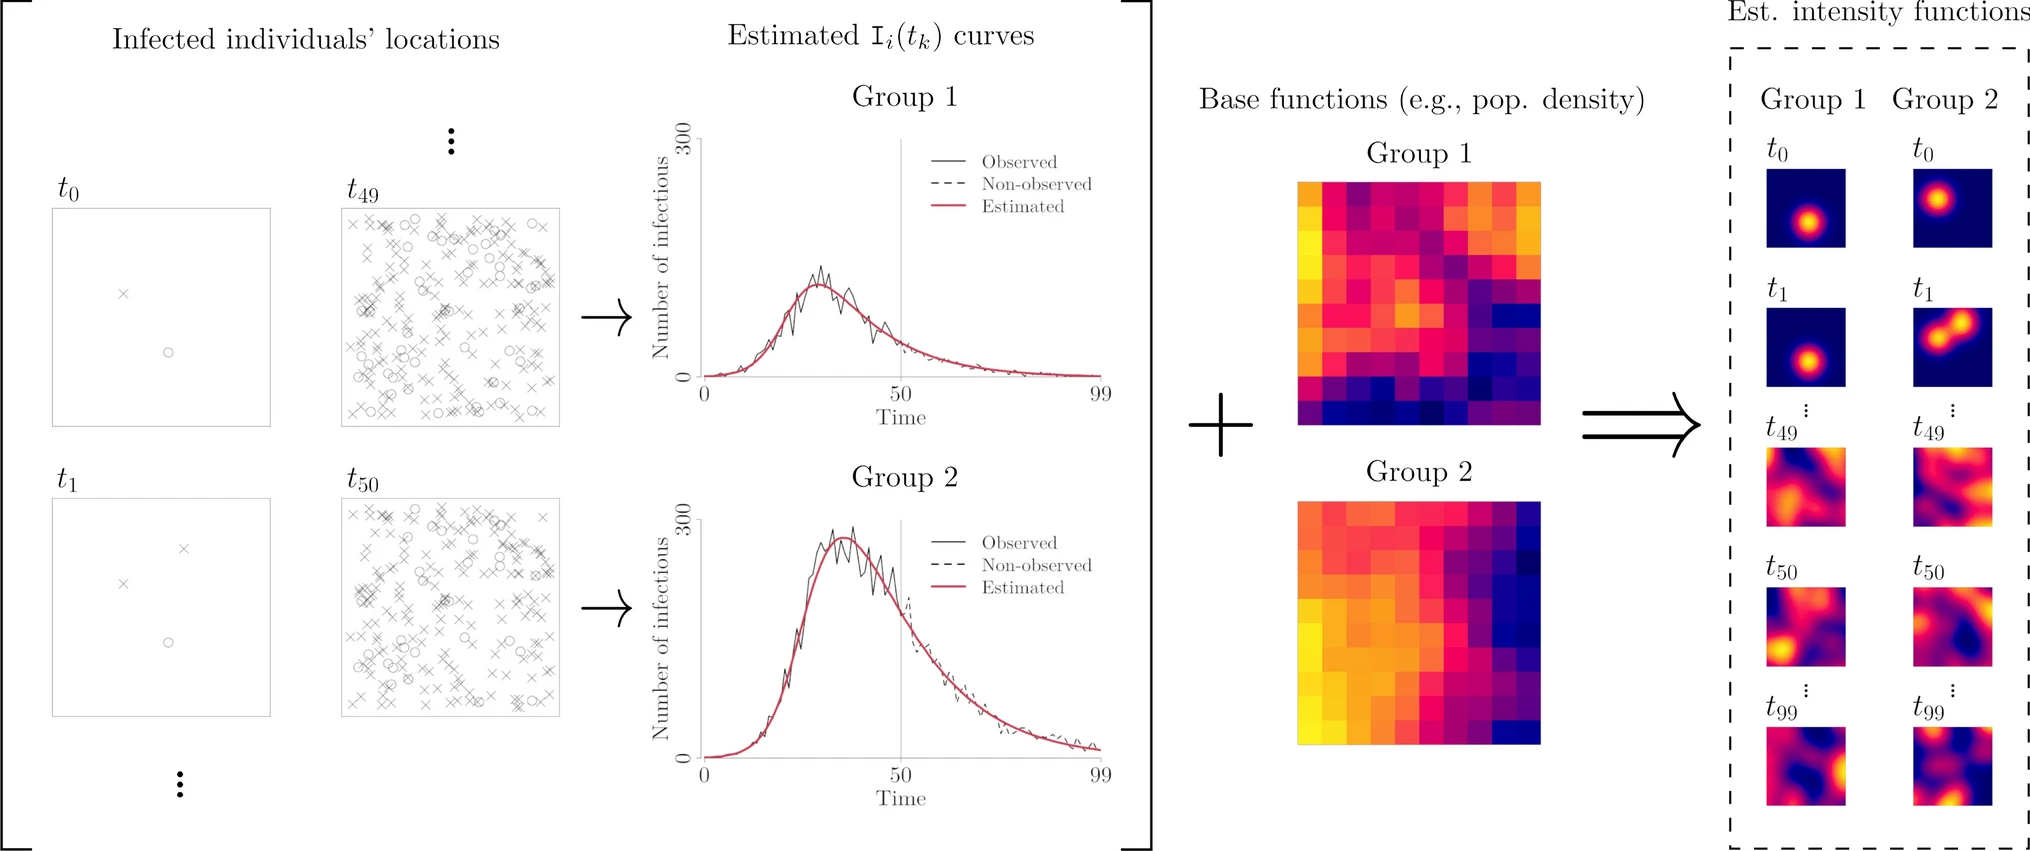
We extend the SIR model to incorporate age-stratified contact information, and estimate the spatio-temporal intensity for each population group
Contact matrix with the average number of contacts of individuals with different age groups
Individuals in all age groups tend to mix with others of similar age.
This pattern most pronounced in those aged 5–24 years, least pronounced in those aged 55–69
Children mix with adults 30–39. Middle-aged adults mix with elderly
SIR + LGCP with age contact information
Using simulations and real data, we showed SIR+LGCP model has better performance than LGCP models that do not do use information from the SIR model, especially when making predictions
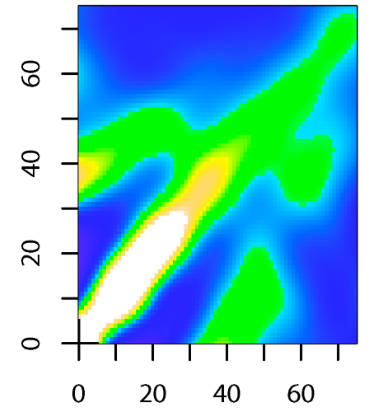
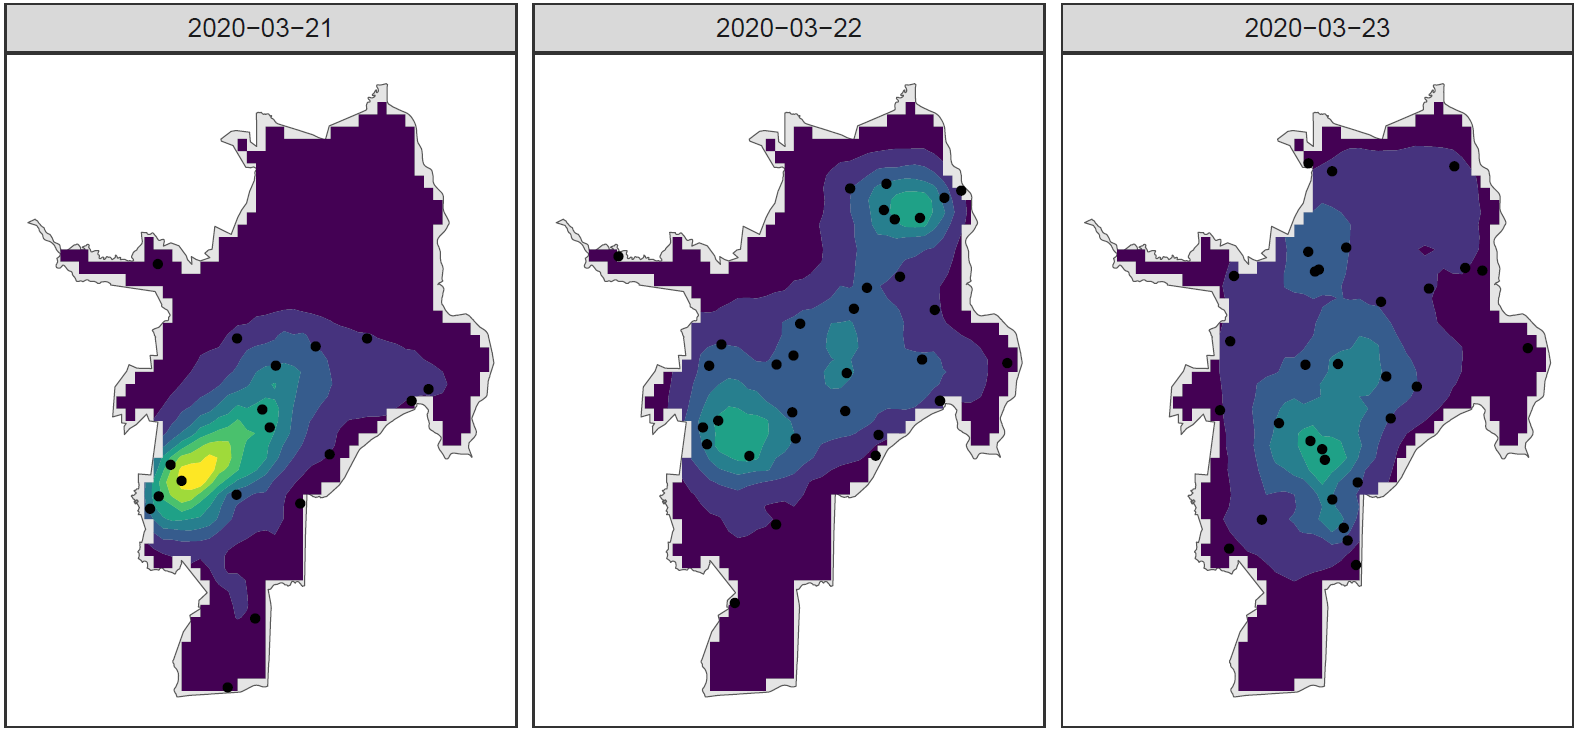
Spatio-temporal disease intensity
SIR+LGCP model allows us to identify high-risk locations and vulnerable populations to better develop strategies for disease prevention and control
Velocities of disease spread
The spatio-temporal disease intensity obtained can be used to calculate the velocities of disease spread
Directions and magnitudes of the velocities can be mapped at specific times to better examine the spread of the disease throughout the region
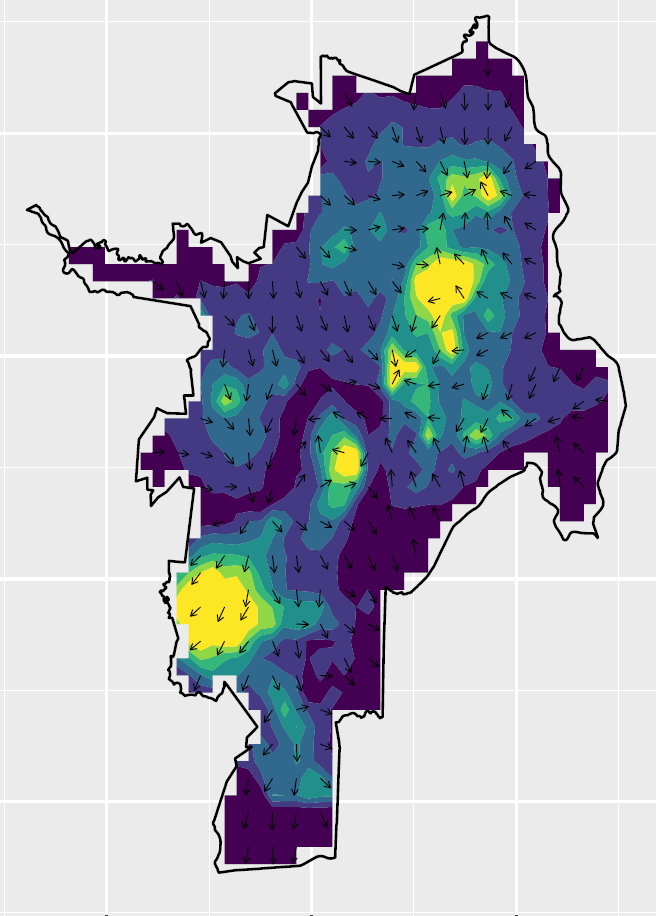
Rodriguez, Mateu and Moraga, International Statistical Review, 2026
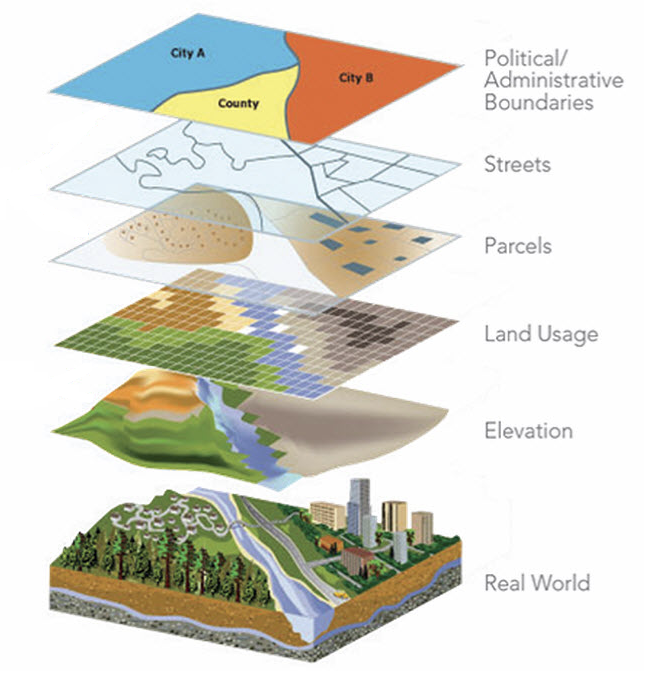
Spatial data
In disease surveillance, we need to analyze data available at different spatial and spatio-temporal resolutions and that come from different sources
Data fusion
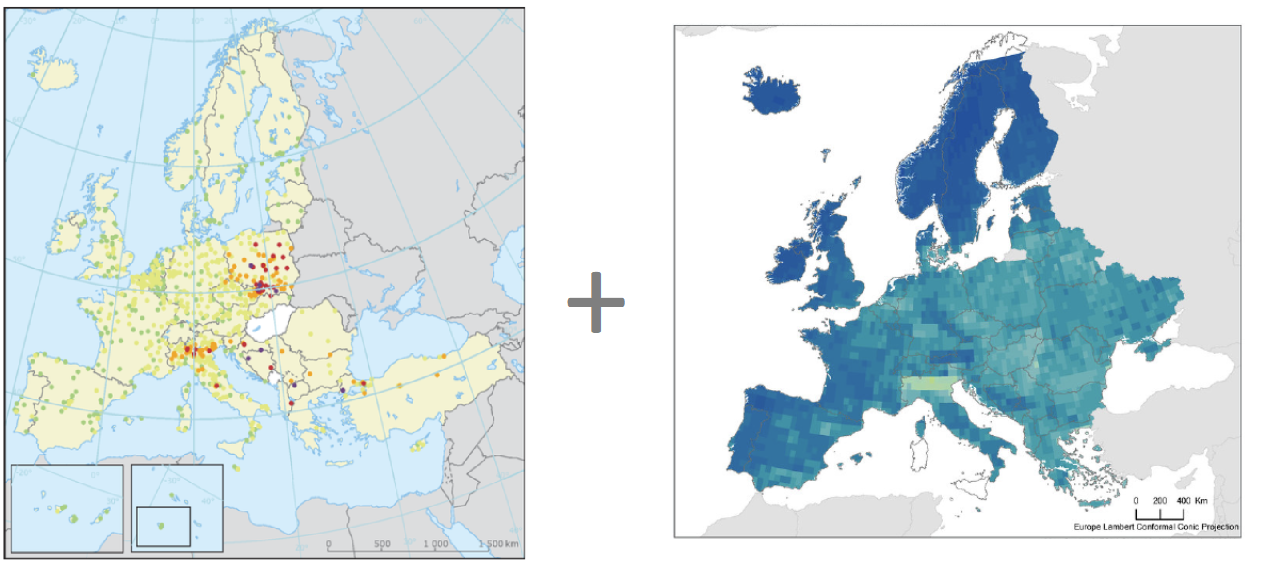
European Environment Agency (EEAA) https://www.eea.europe.eu. NASA Socioeconomic Data and Applications Center (SEDAC) https://sedac.ciesin.columbia.edu
Fast and flexible spatial modeling by assuming a spatially continuous variable underlying all observations modeled using a Gaussian random field
Multivariate downscaling of air pollutants
Improve resolution from 10 to 2 km, reveal dependencies among pollutants
Rodriguez, Chacon and Moraga, The American Statistician, 2025
Spatio-temporal downscaling of air pollutants
Spatial resolution from 80 to 30 km and temporal resolution from 3 to 1 hour
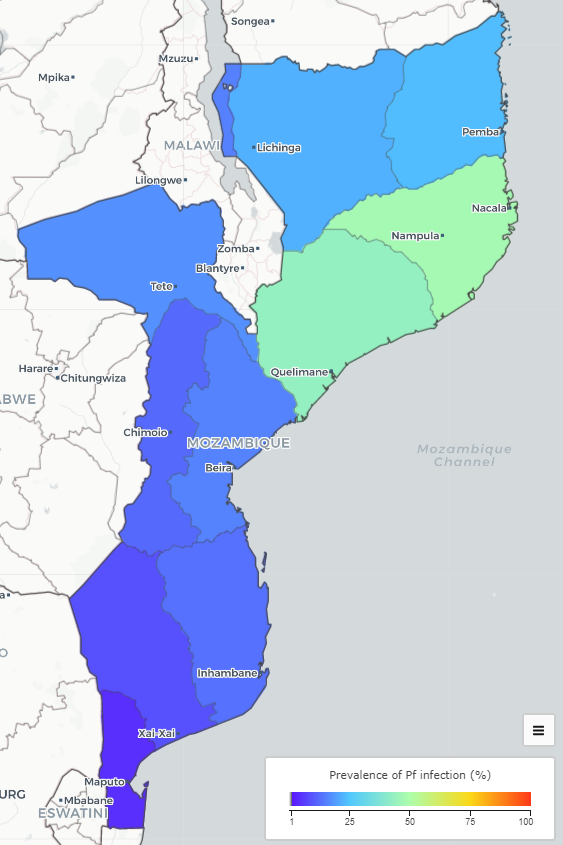
Precision disease mapping
Disease mapping is important to understand geographic and temporal patterns of diseases and allocate resources where most needed
Often, maps given at an areal resolution which difficulties decision-making
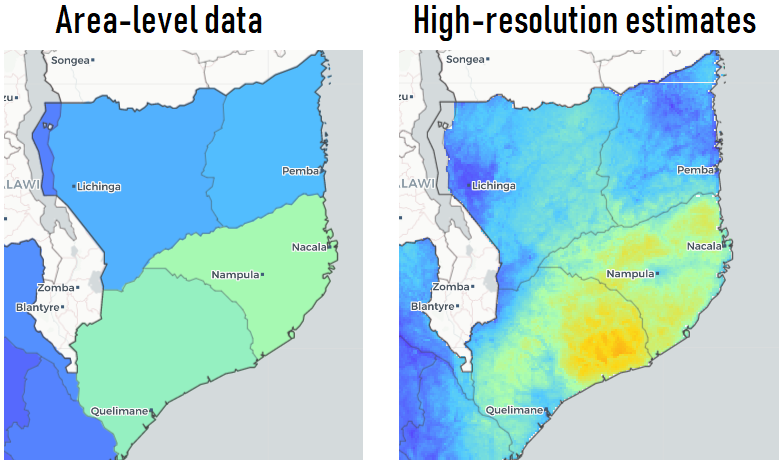
Map shows malaria prevalence in Mozambique. However, disease risk varies continuously in space & areal data unable to show how risk varies within areas
Areal estimates make difficult targeting health interventions and directing resources where most needed
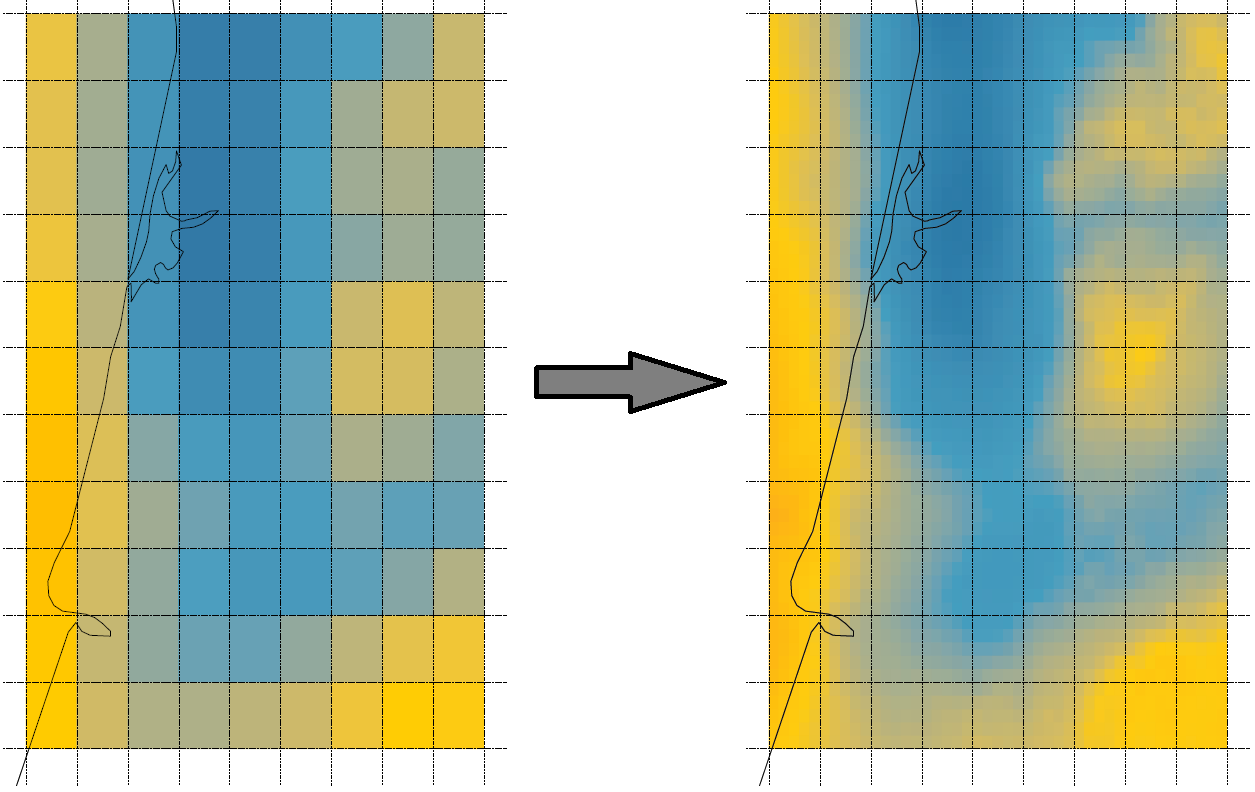
Disaggregate area-level data
High-resolution estimates permit to find differences in disease risk within study regions, and identify areas and groups of people at higher risk
Open-Source Disease Surveillance System
Team
 Xiang Chen |
 Yang Xiao |
 Guilherme Soares |
 Andre Victor Ribeiro Amaral |
 Fernando Rodriguez |
 Ruiman Zhong |
 Hanan Alahmadi |
 Jonatan Gonzalez |
Visit Fiocruz and InfoDengue group, Brazil

Visit Ministry of Health and University, Malaysia
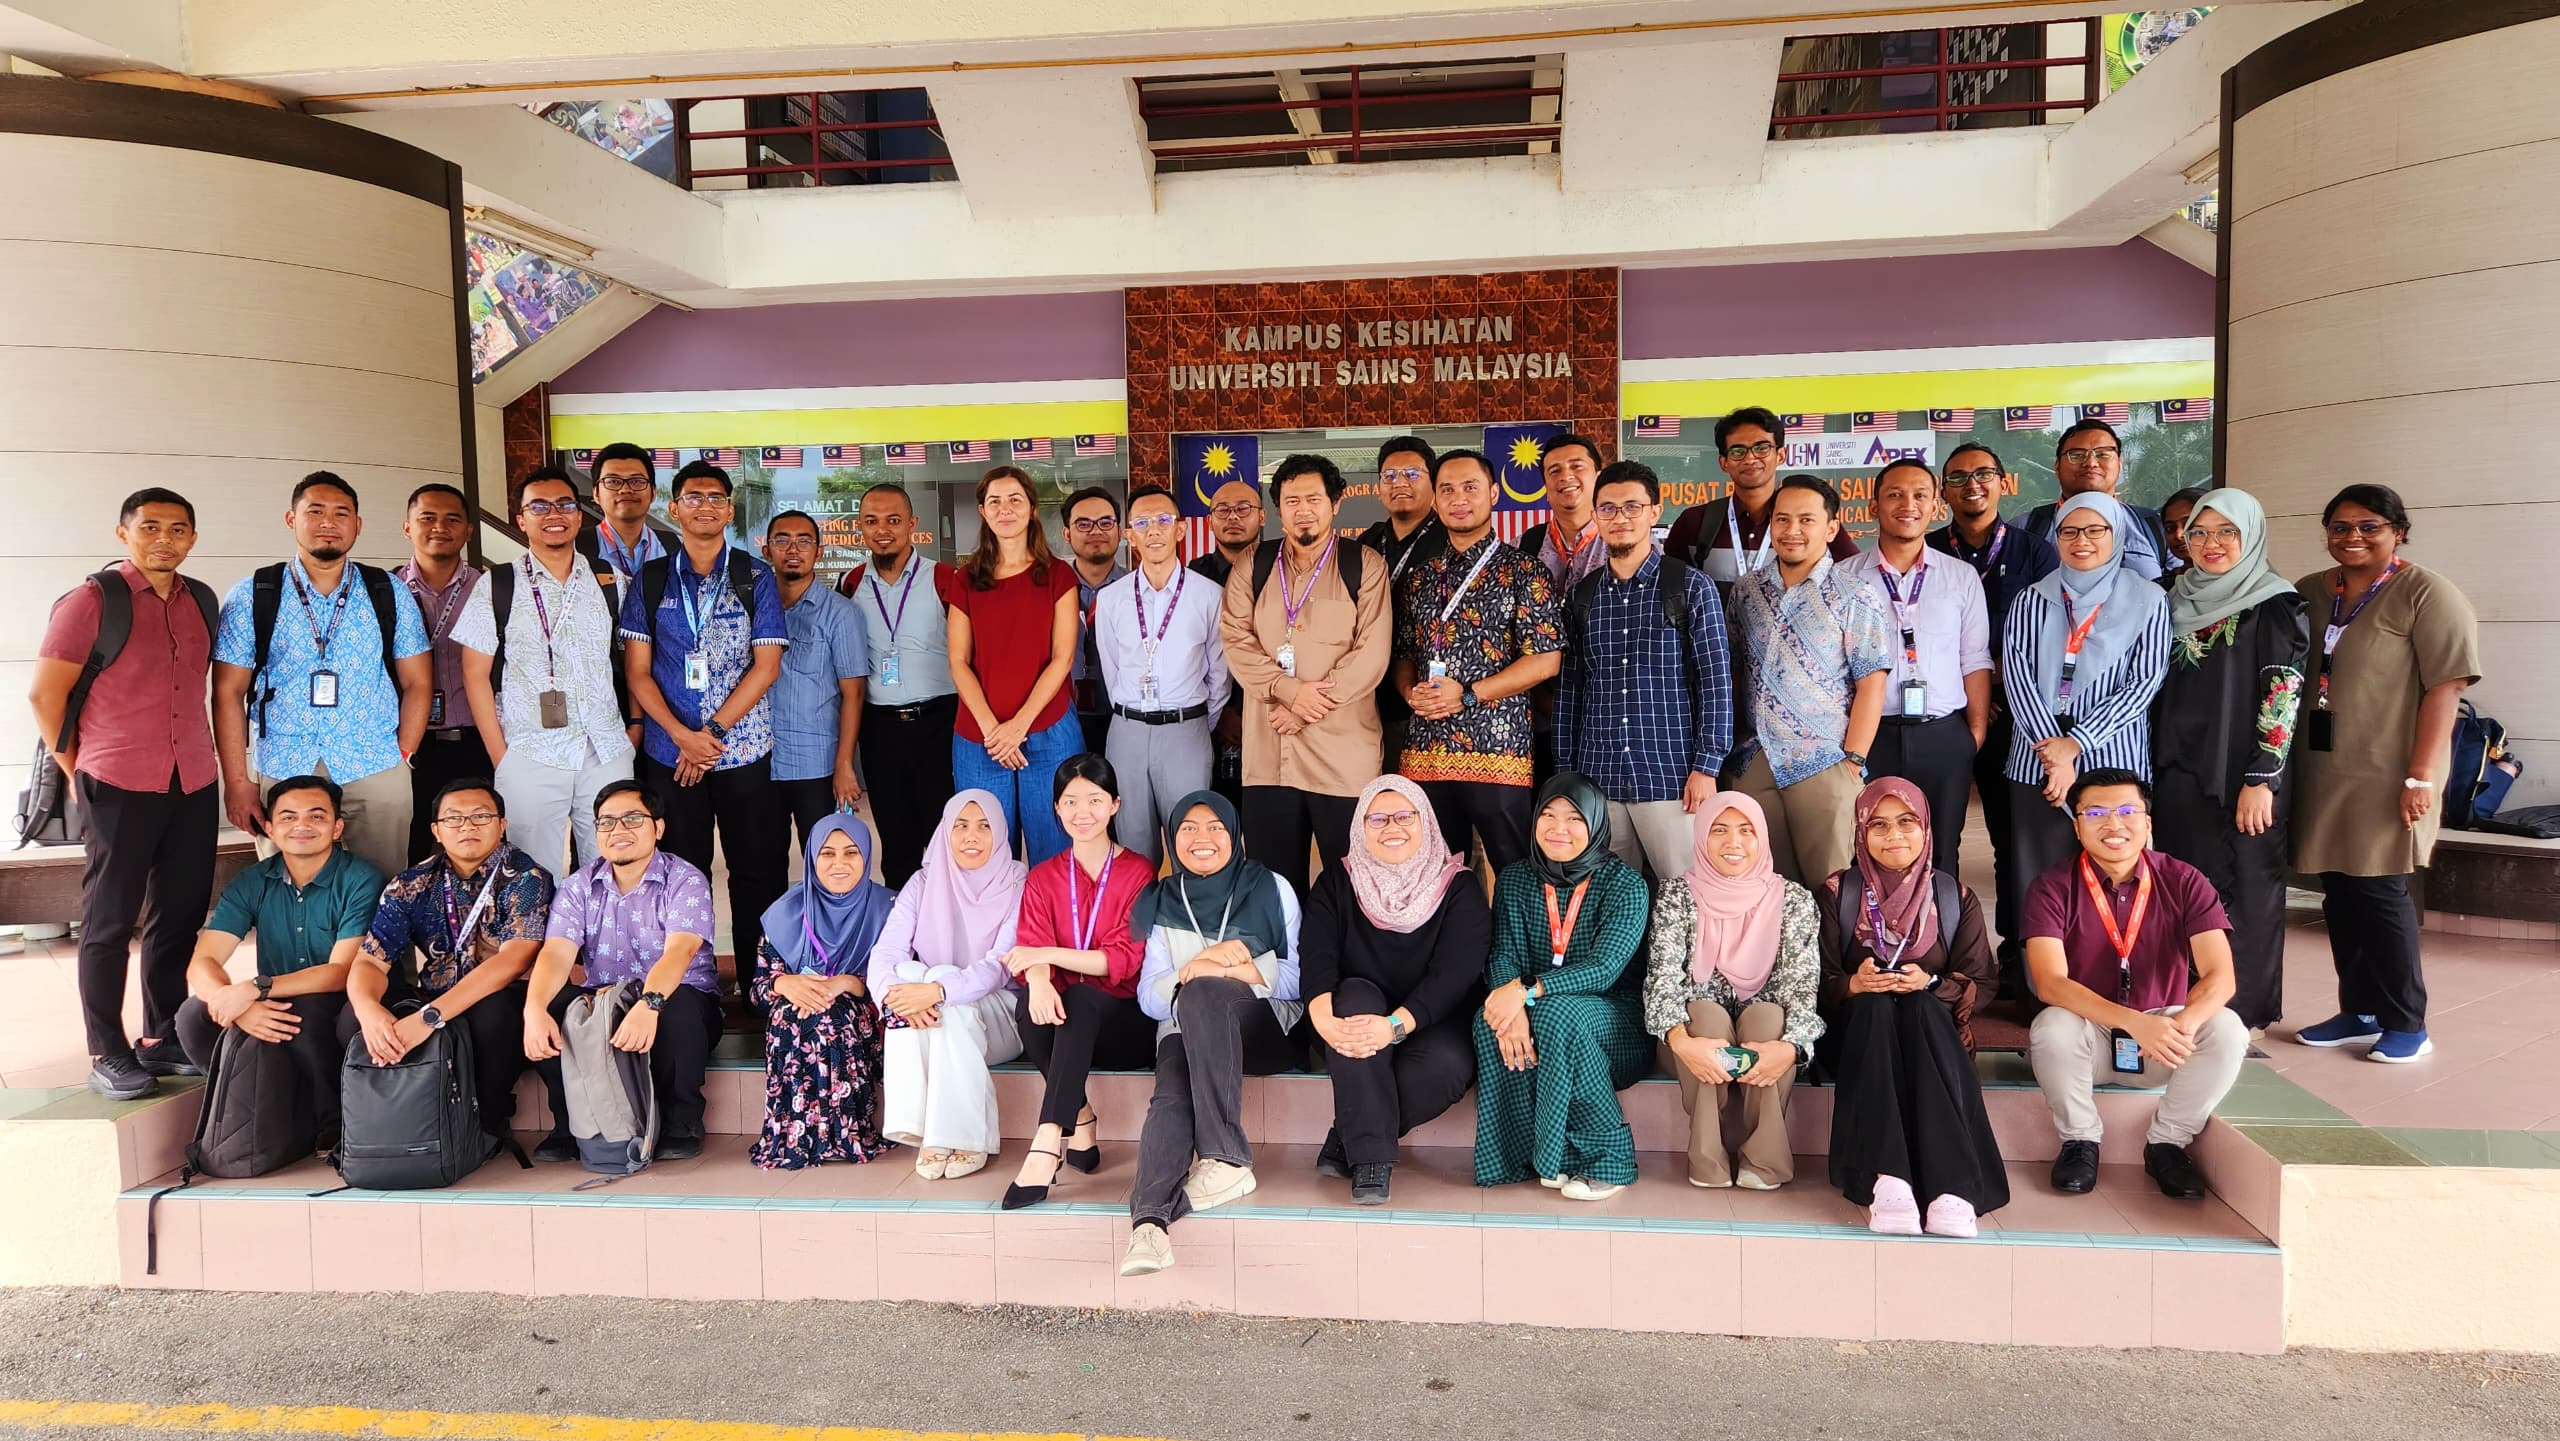
Visit Ministry of Health and University, Malaysia
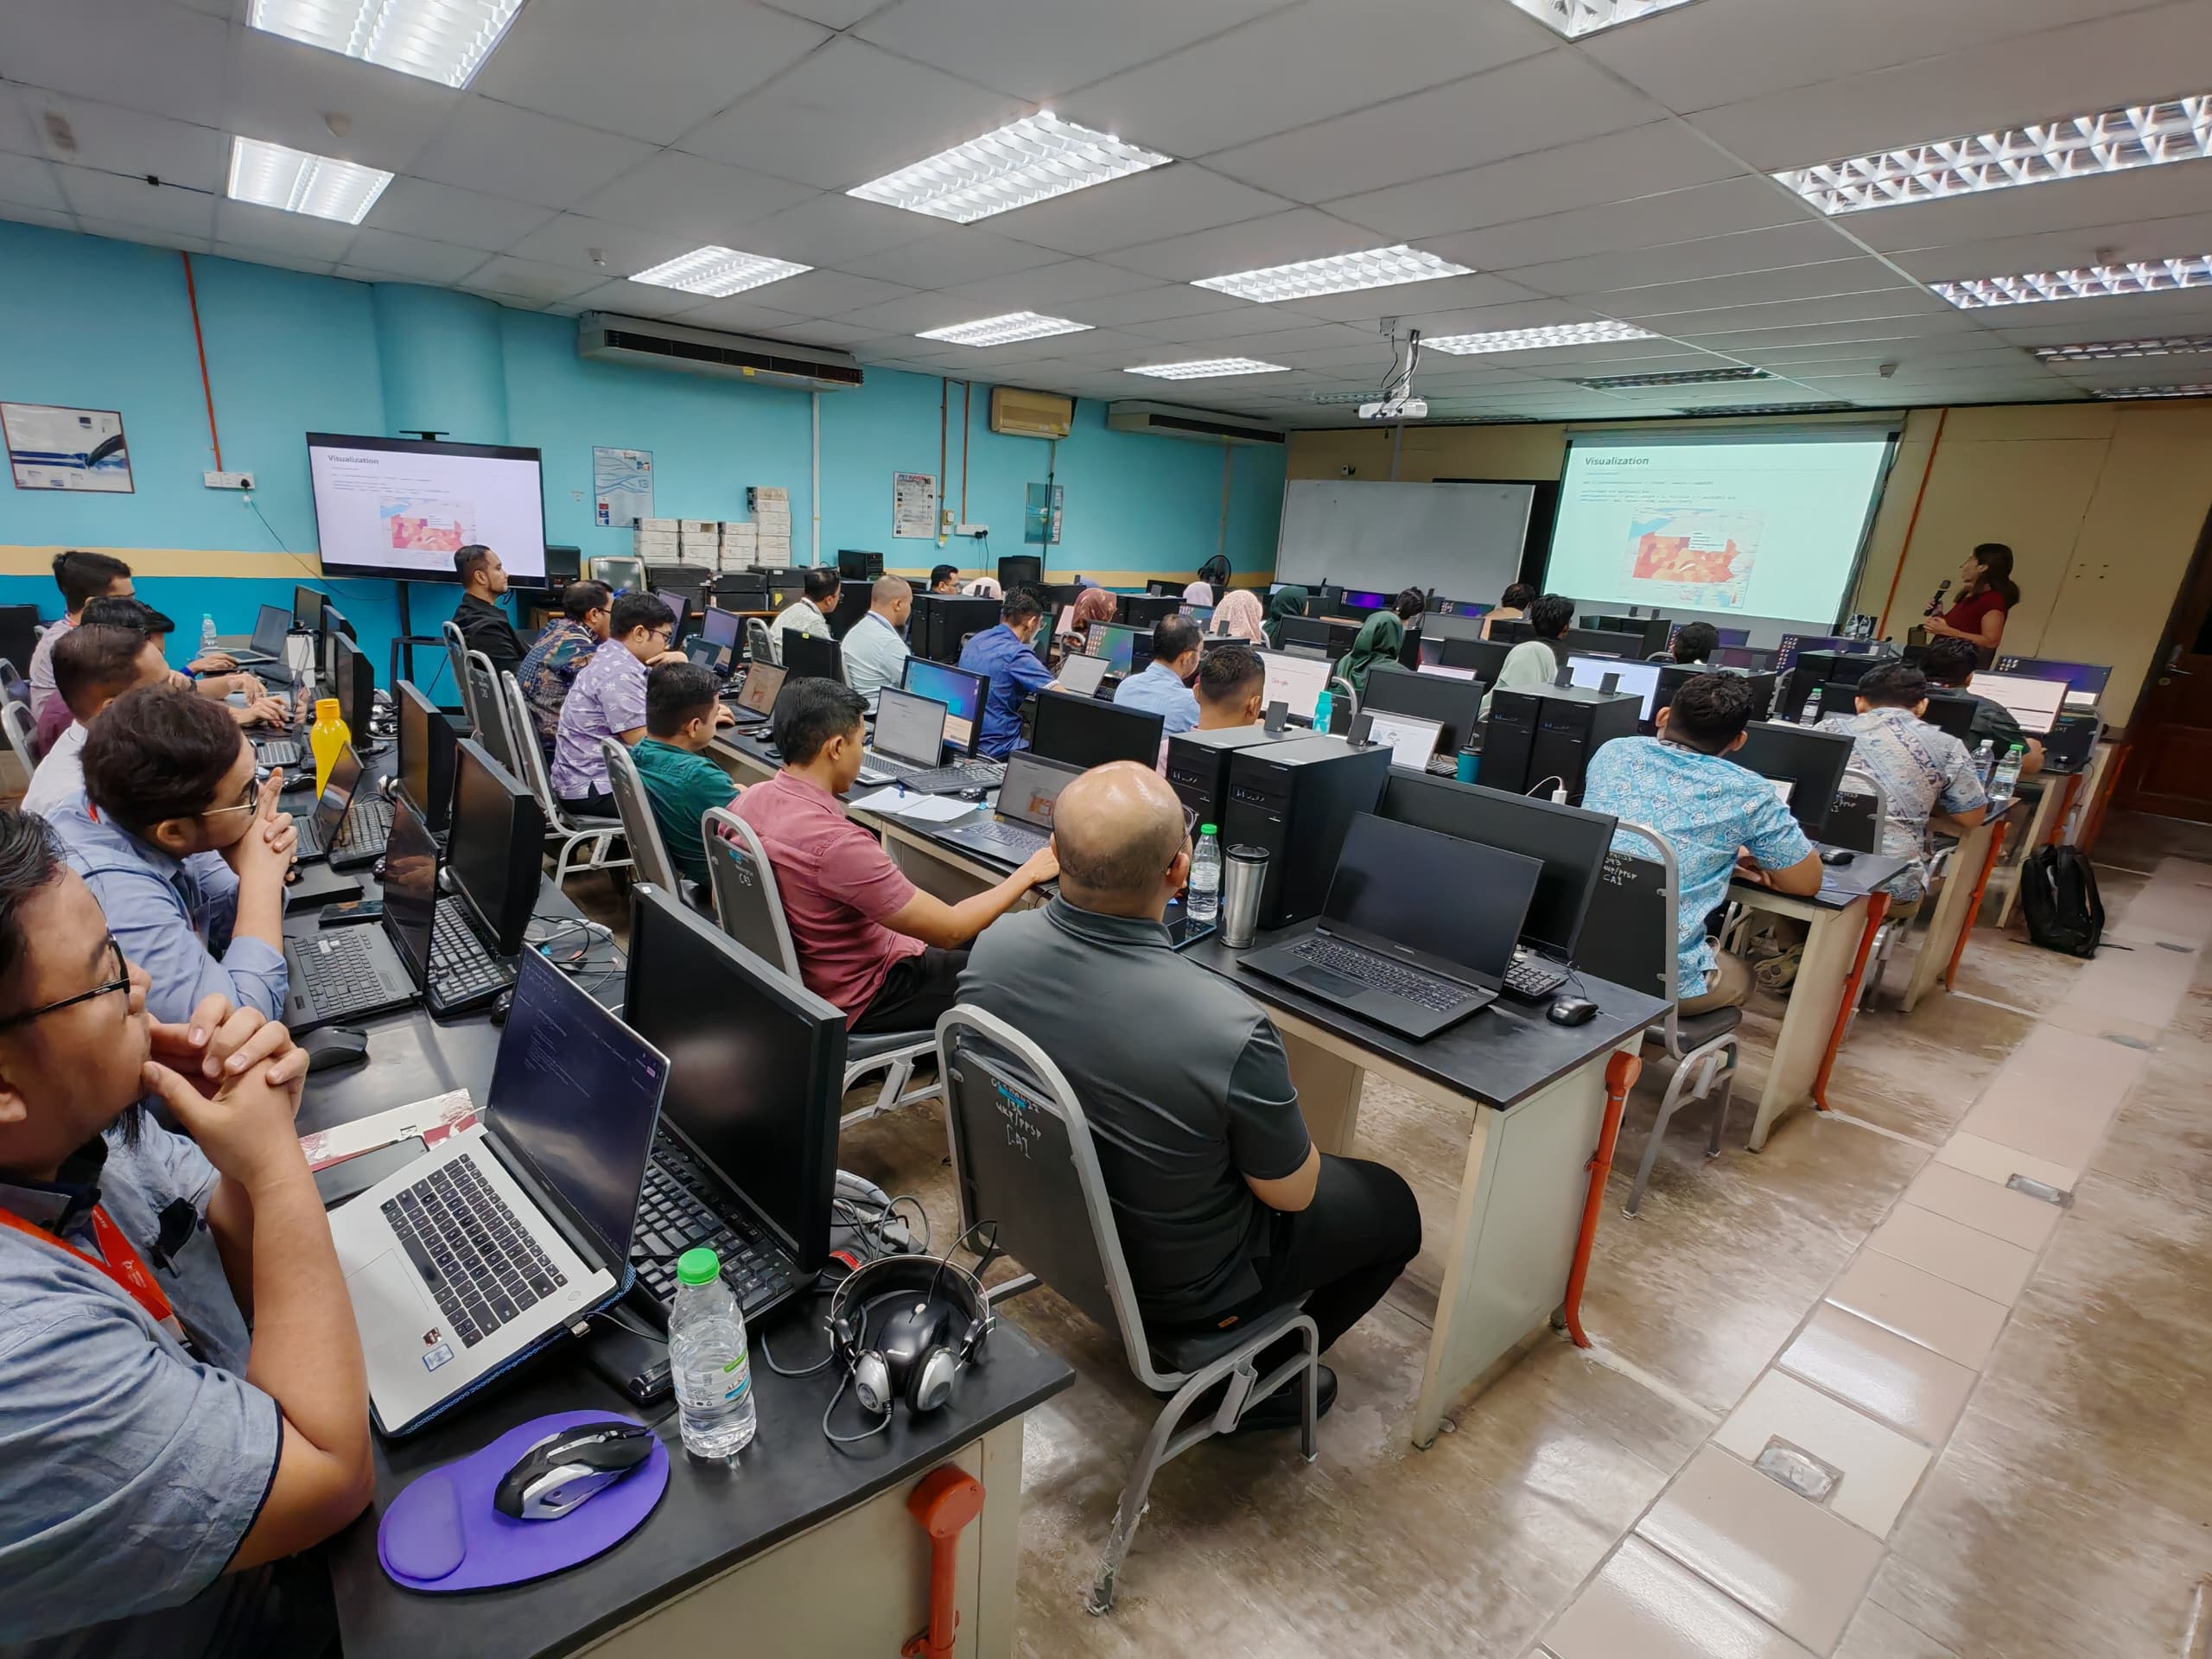
Capacity Building
Courses equip researchers on methods and tools to quantify disease burden, understand geographic and temporal patterns, identify risk factors, and measure inequalities
They also show how to easily turn analyses into visually informative and interactive reports and dashboards that facilitate the communication of insights to collaborators and policymakers
Books
Geospatial Health Data: Modeling and Visualization (2019) http://www.paulamoraga.com/book-geospatial/
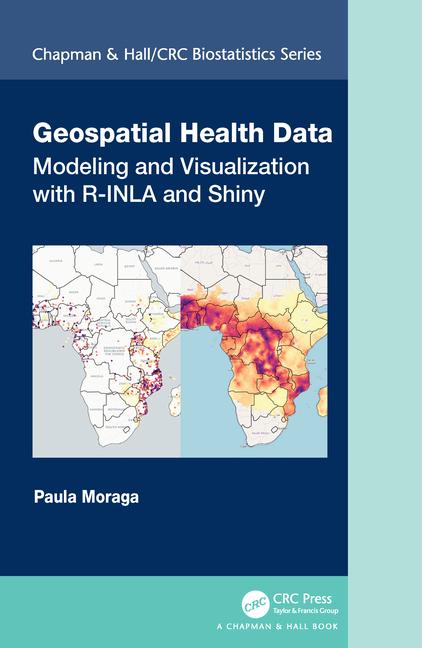

Manipulate and transform point, areal, raster data, create maps with R
Fit and interpret Bayesian spatial, spatio-temporal models with INLA, SPDE
Interactive visualizations, reproducible reports, dashboards and Shiny apps
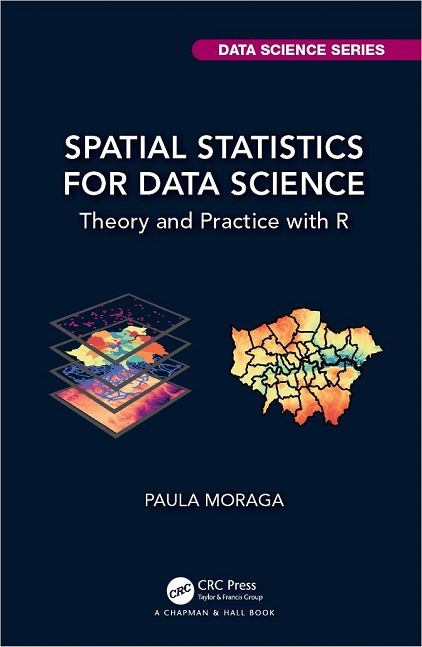
Spatial Statistics for Data Science: Theory and Practice with R (2023) http://www.paulamoraga.com/book-spatial/
Spatial data: types, retrieval, manipulation and visualization. Statistical methods and models to analyze spatial data using R
Areal data: spatial neighborhood matrices, autocorrelation, models
Geostatistical data: interpolation, model-based geostatistics
Point patterns: intensity estimation, clustering, point process models
Reproducible examples in environment, ecology, epidemiology, crime, real estate
Conclusions
Disease spread has no borders and it is urgent that we work together
Data is crucial for public health decision-making. We need data but not just any data. We need reliable, relevant, timely and detailed data to understand how different populations and regions are doing and be able to take efficient and effective actions to reduce disease burden and protect all populations
Collaborative research, data, and analytical tools crucial for solving health challenges, achieving sustainable development, and leaving no one behind
Aligned with the priorities of KAUST and Saudi Vision 2030, my work will strengthen the Kingdom’s leadership in health innovation to support healthier and longer lives for people in Saudi Arabia and beyond

Thank you!
|
|
|

|
|
|
|
|