SpatialEpiApp
SpatialEpiApp is a Shiny app for disease risk estimation, cluster detection, and spatial and spatio-temporal interactive visualization. The application incorporates modules for
- Disease risk estimation using INLA
- Detection of clusters using the scan statistics implemented in SaTScan
- Interactive visualizations such as maps supporting padding and zooming and tables that allow for filtering
- Generation of reports containing the analyses performed
The application is implemented in the R package SpatialEpiApp. The development version from GitHub can be obtained with devtools::install_github("Paula-Moraga/SpatialEpiApp") and launched by executing library(SpatialEpiApp); run_app(). If you do not have R installed you can see how the application works here.

epiflows
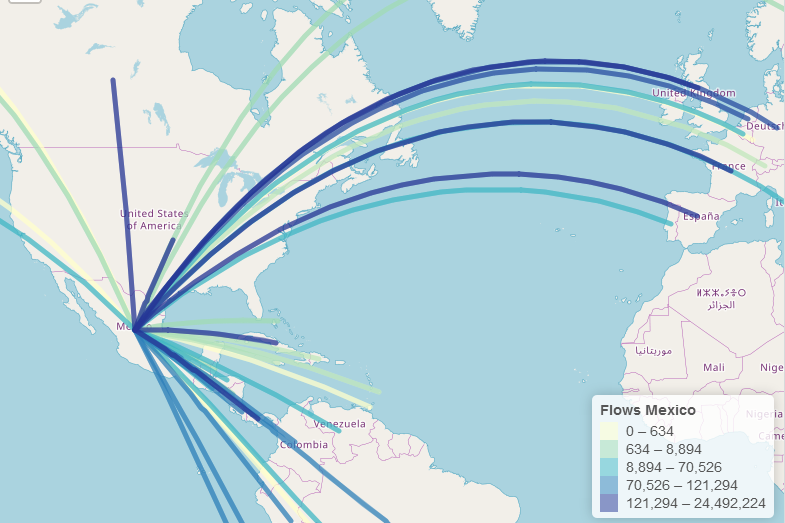
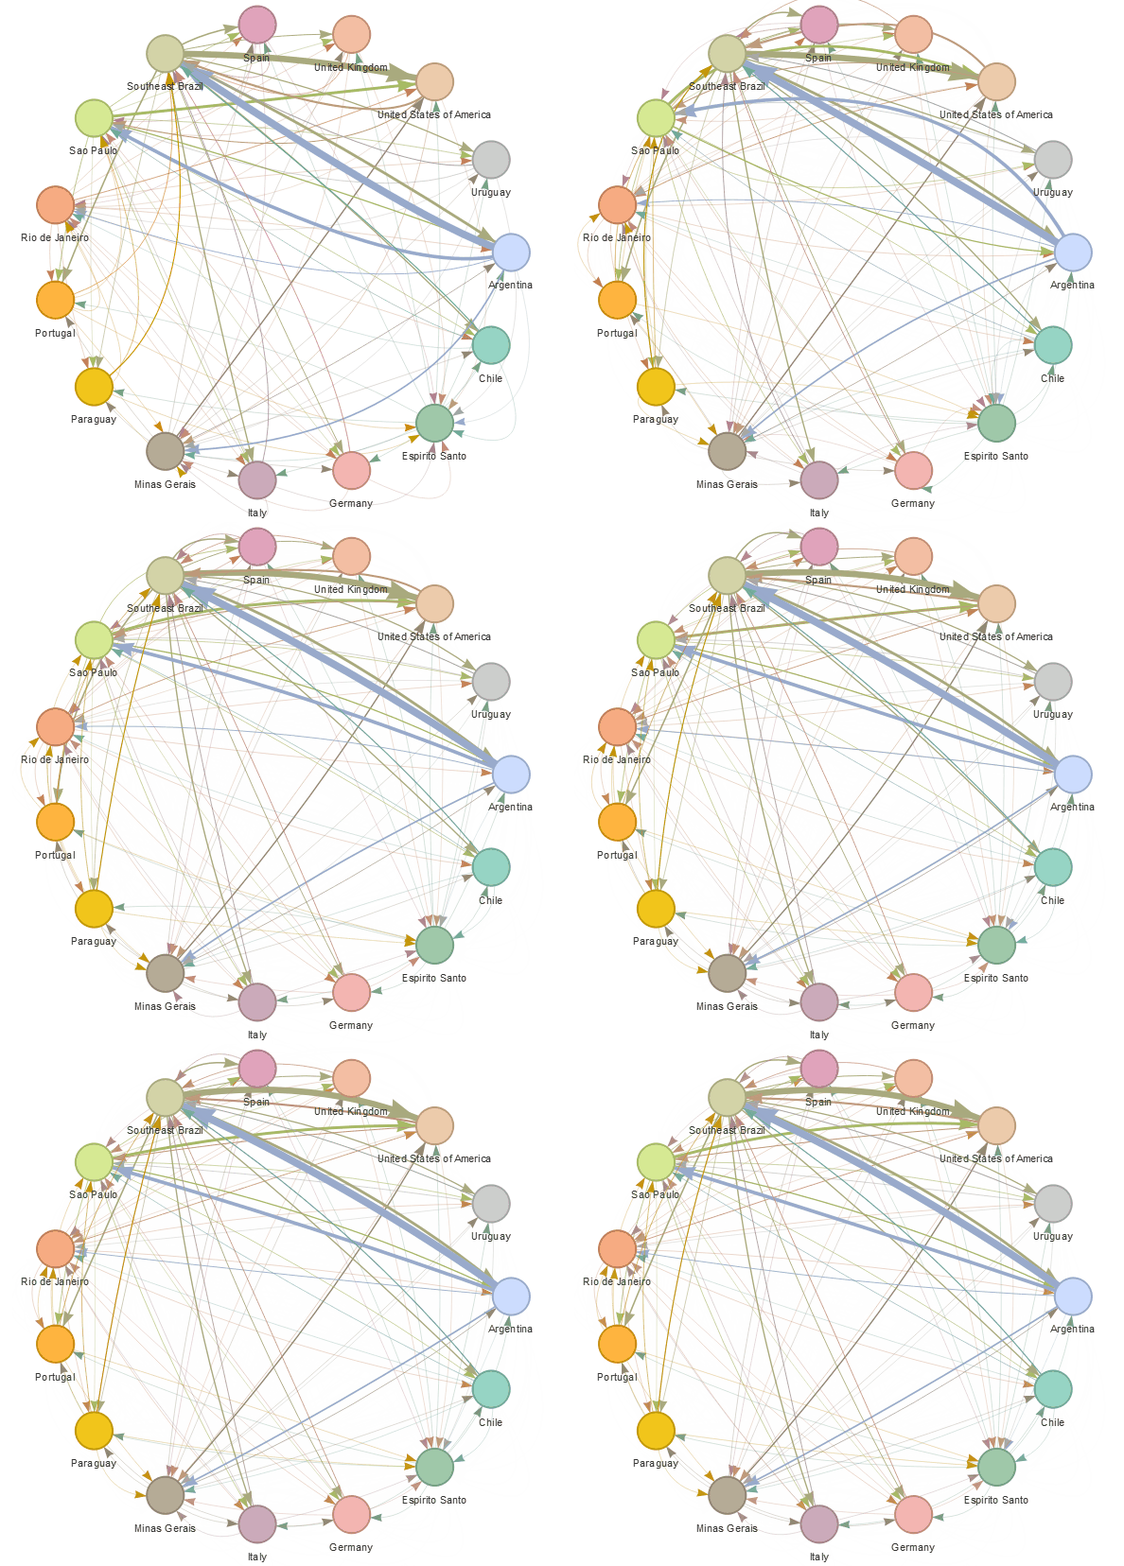
epiflows is an R package for risk-assessment of travel-related spread of disease. The package implements a mathematical model that predicts the number of cases that could be spread to other locations from an infectious location together with uncertainty measures. The model integrates information about the number of infectious cases, population flows, lengths of stay, and incubation and infectious periods.


rspatialdata
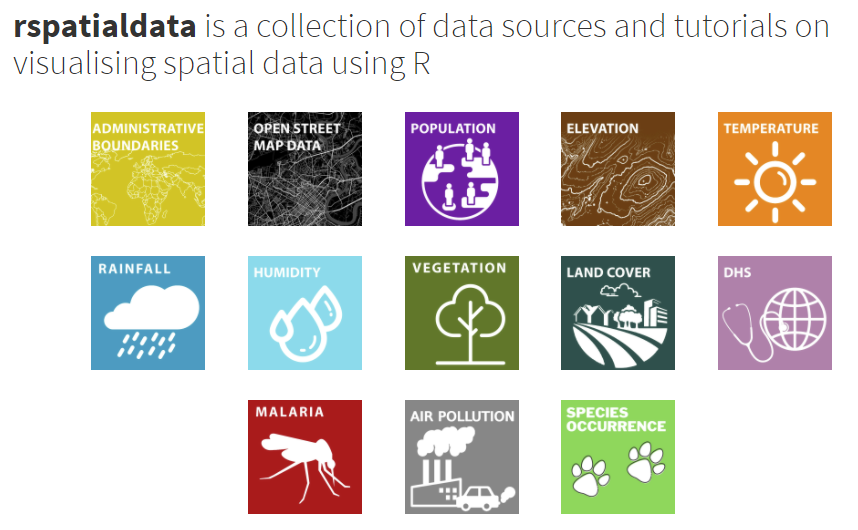
rspatialdata is a collection of data sources and tutorials on visualising spatial data using R
