ggplot2 - practice
Solutions: https://www.paulamoraga.com/book-r/99-problems-ggplot2-axes-solutions.html
Dataset mtcars {datasets} contains data on fuel
consumption and 10 aspects of automobile design and performance for 32
automobiles
mpgMiles/(US) gallondispDisplacement (cu.in.)
Default plot
library(ggplot2)

ggplot(mtcars) +
  geom_point(aes(disp, mpg)) +
  scale_x_continuous(name = "Displacement")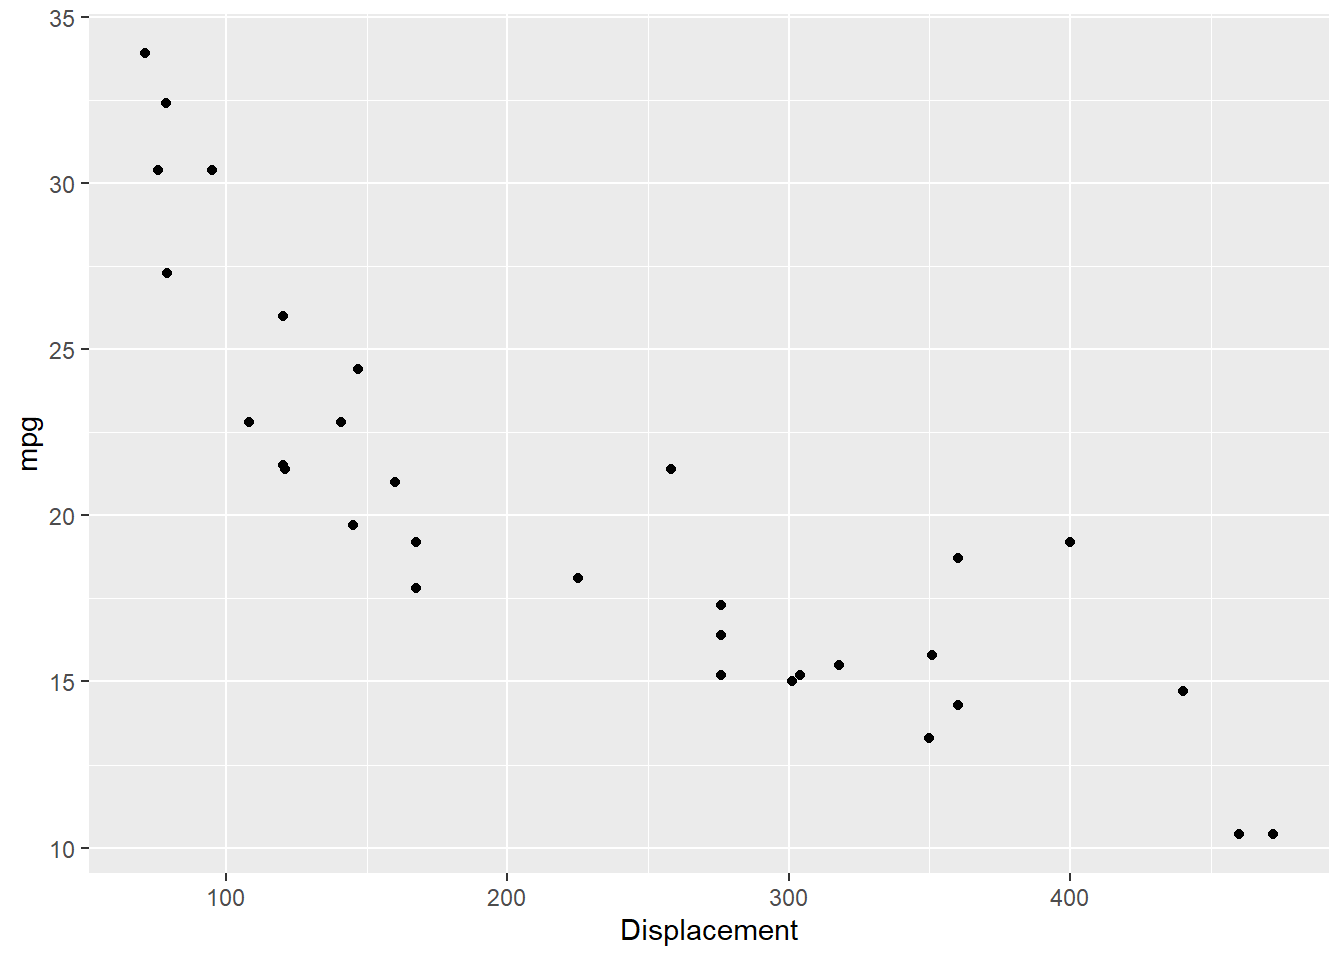
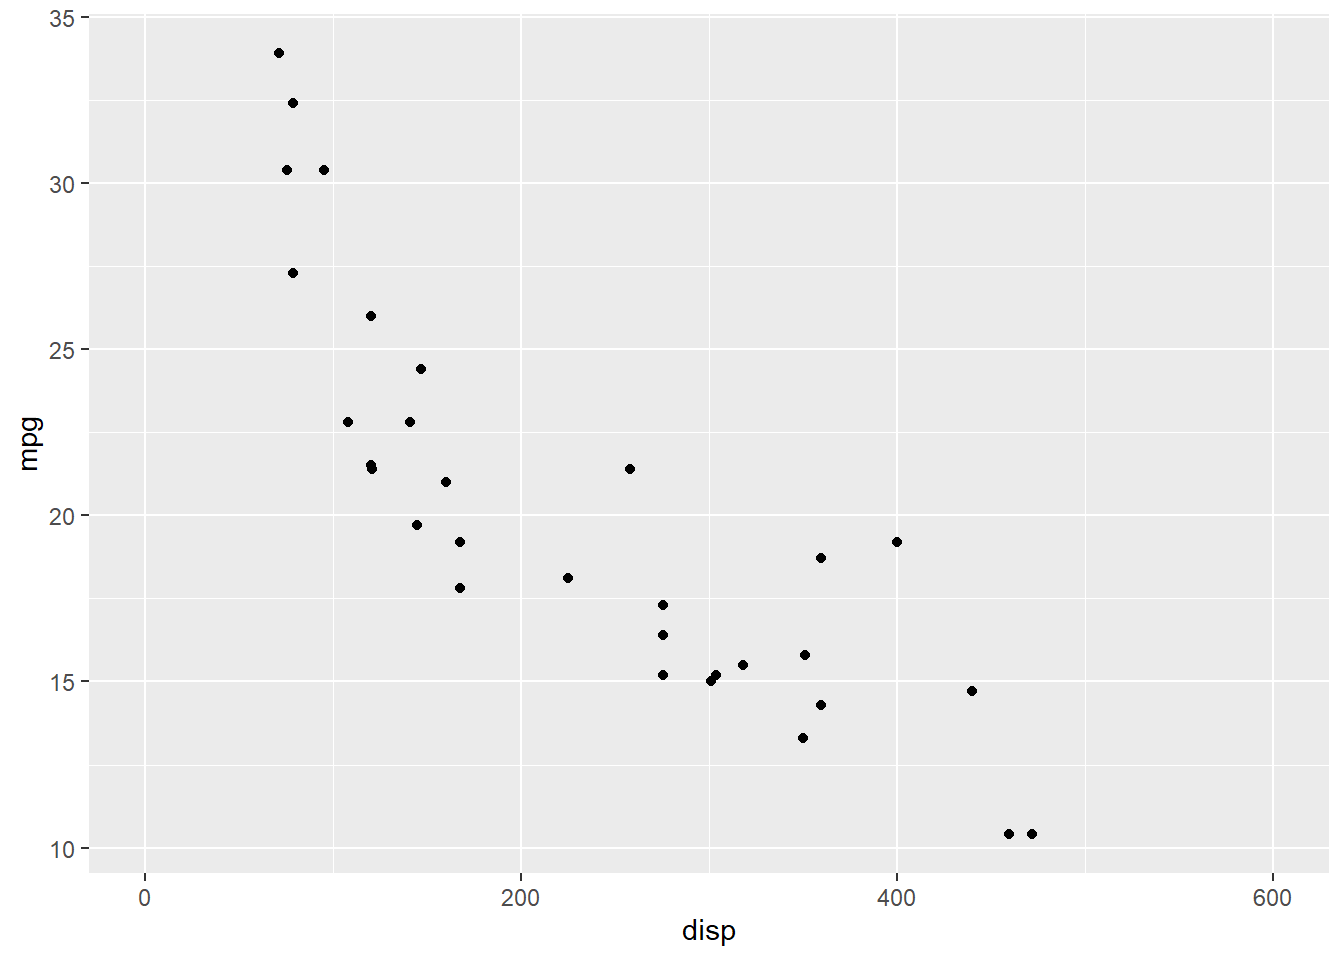
Changing axis limits
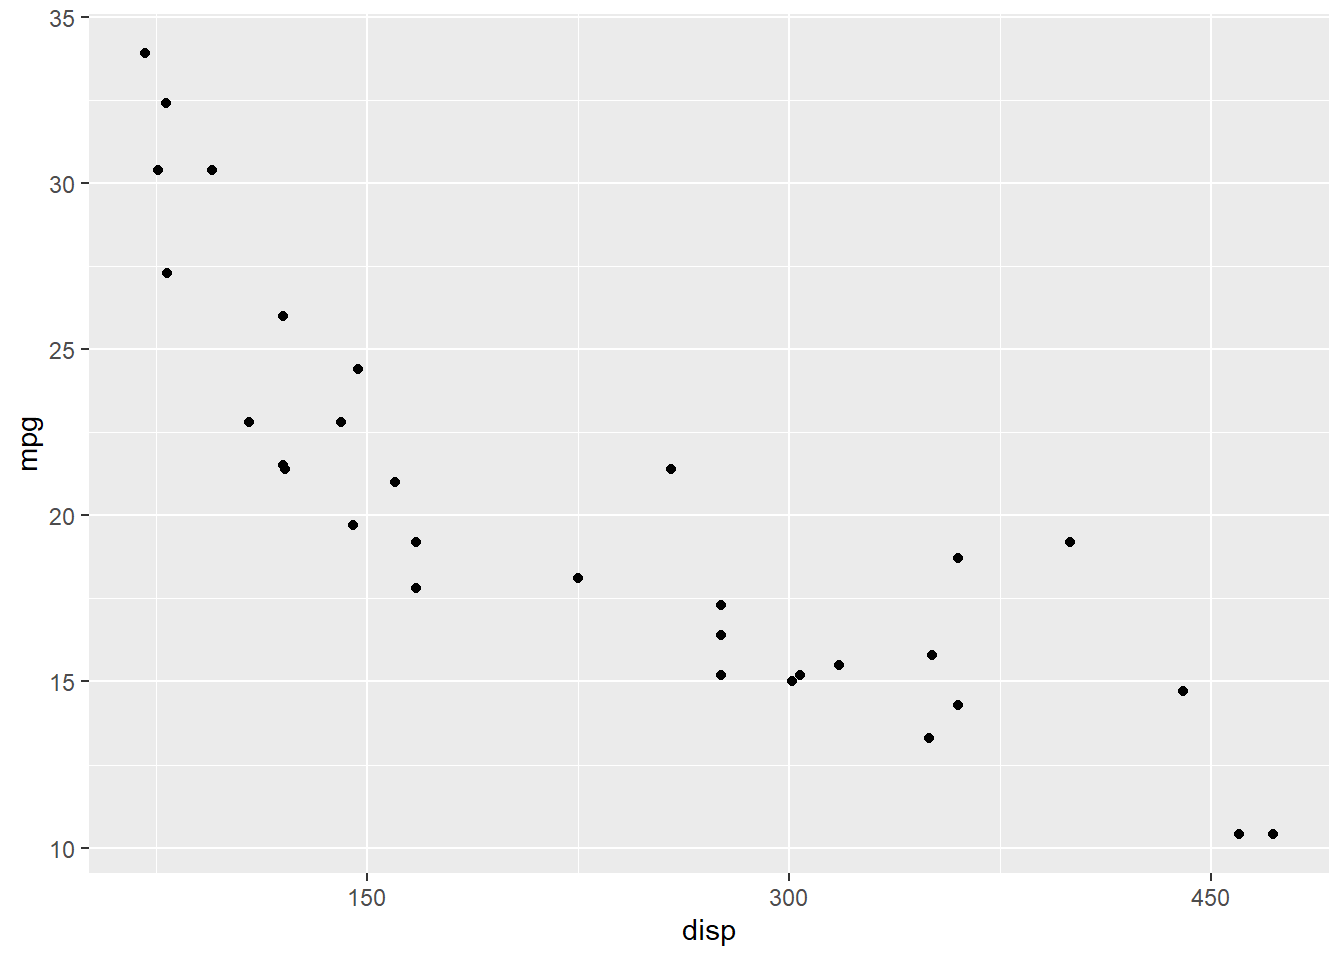
Changing axis ticks
The breaks argument is used to specify where the ticks
appear. It takes a numeric vector equal to the length of the number of
ticks.
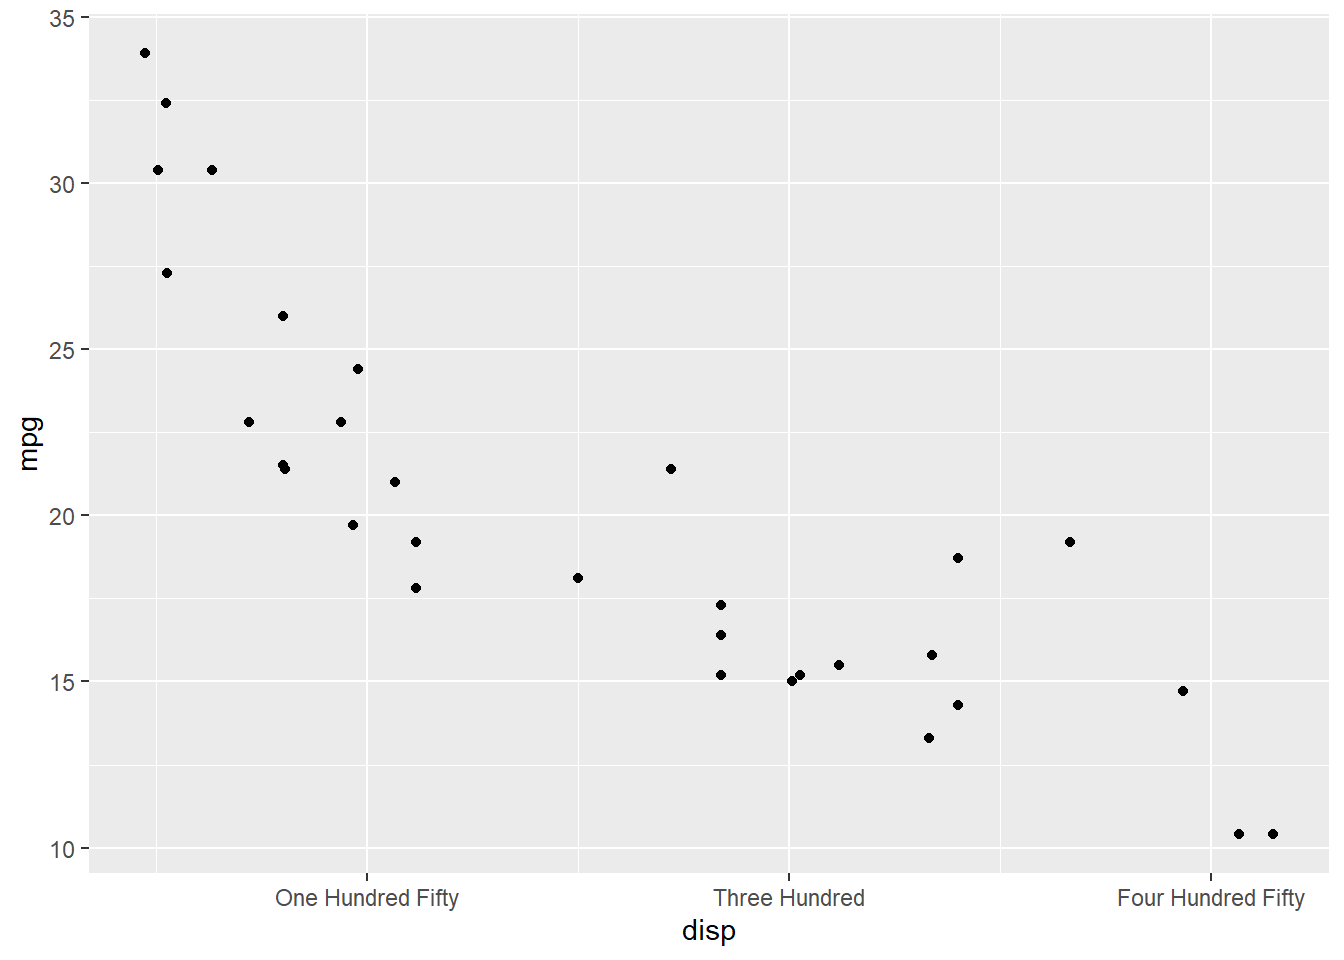
Changing tick labels
You can change the tick labels using the labels
argument. In the below example, we use words instead of numbers. When
adding labels, we need to ensure that the length of the
breaks and labels are the same.
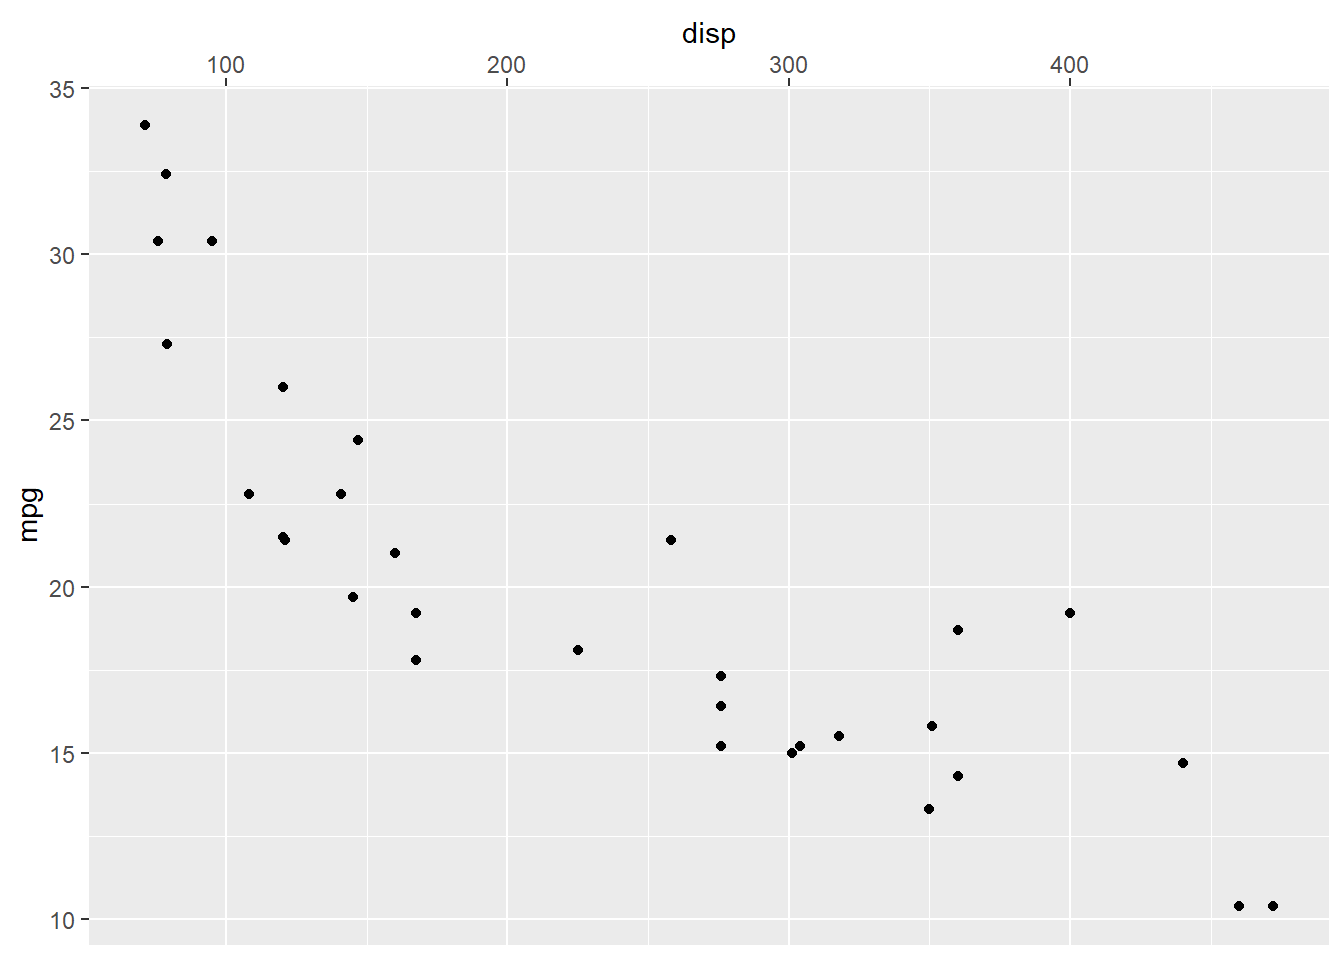
Changing position of labels
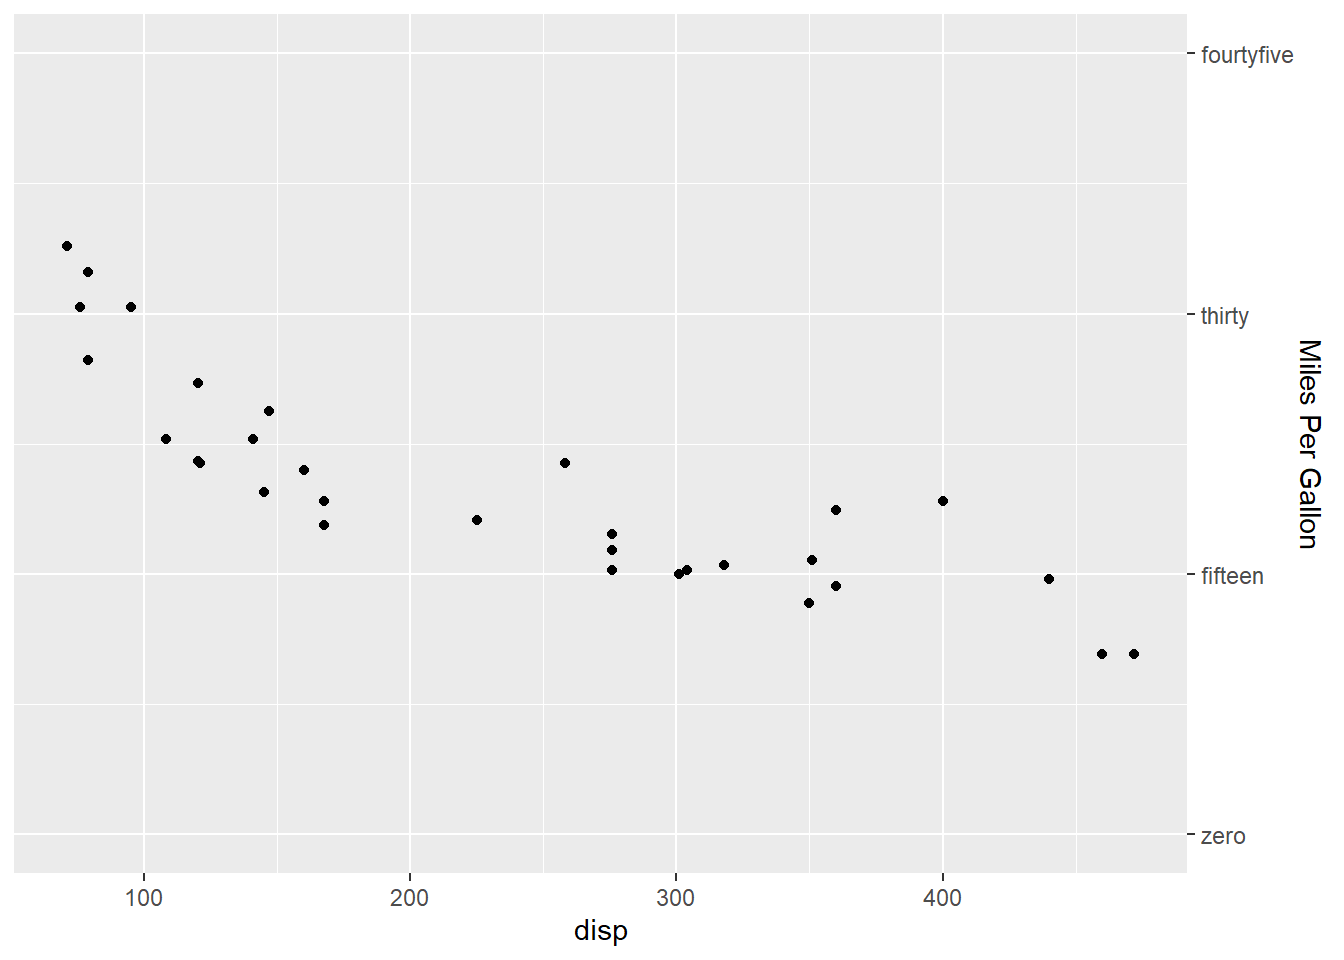
Y-axis example
Everything above using scale_x_continuous() can be used
in the same way for y axis with scale_y_continuous().
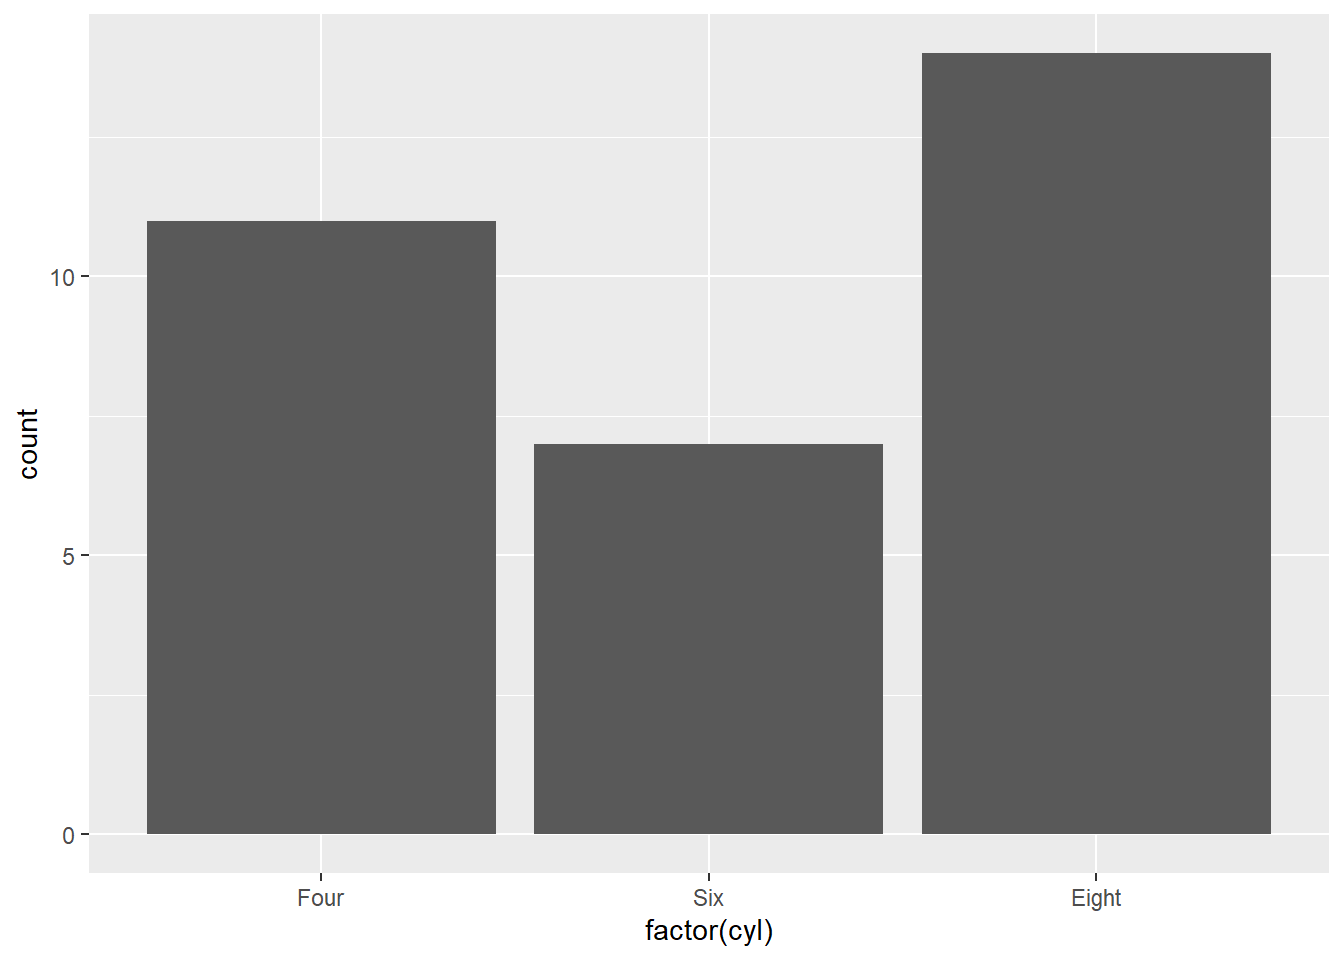
Discrete axis labels
ggplot(mtcars) +
  geom_bar(aes(factor(cyl))) +
  scale_x_discrete(labels = c("4" = "Four", "6" = "Six", "8" = "Eight"))