Shiny web applications
1 Shiny
Shiny is a web application framework for R that enables to build interactive web applications. For example, the SpatialEpiApp package provides a Shiny app for disease risk estimation, cluster detection, and interactive visualization. Other Shiny app examples can be seen at https://shiny.rstudio.com/gallery/.
A Shiny app can be built by creating a directory that contains an R
file with three components. Namely, a ui user interface
object which controls layout and appearance of the app, a
server() function with instructions to build objects
displayed in the ui, and a call to shinyApp() that creates
the Shiny app from the ui/server() pair.
# define user interface object
ui <- fluidPage( )
# define server() function
server <- function(input, output){ }
# call to shinyApp() which returns the Shiny app
shinyApp(ui = ui, server = server)
In the ui object, we can include input objects that
allow us to interact with the app by modifying their values (e.g.,
texts, dates, files), and outputs objects we want to show in the app
(e.g., texts, tables, plots). The server() function
contains the R code to build the outputs. If this code uses an input
value, the output will be rebuilt whenever the value changes creating
reactivity. The app directory can also contain data or other R scripts
needed by the app. We can also write two separate files
ui.R and server.R. This permits an easier
management of the code for large apps.
There are two options to share a Shiny app. We can share the R
scripts with other users and they launch the app from R with the
runApp() function specifying the path of the directory of
the app. Another option is to host the app as a web page at its own URL
so the app can be navigated through the internet with a web browser.
This option does not require the app users to have R.
Resources to learn how to build Shiny apps include the RStudio Shiny website https://shiny.rstudio.com/, the RStudio tutorial https://shiny.rstudio.com/tutorial/written-tutorial/lesson1/, and the Shiny book https://mastering-shiny.org/.
2 References
- RStudio tutorial: https://shiny.rstudio.com/tutorial/written-tutorial/lesson1/
- Book: https://mastering-shiny.org/
- Solutions book: https://mastering-shiny-solutions.org/
- Cheatsheet: https://shiny.rstudio.com/articles/cheatsheet.html
- Function reference: https://shiny.rstudio.com/reference/shiny/1.7.0/
- Tutorial spatial data: https://www.paulamoraga.com/book-geospatial/sec-shinyexample.html
3 Gallery
4 Introduction to Shiny
https://www.paulamoraga.com/presentation-course/#76
https://www.paulamoraga.com/book-geospatial/sec-shiny.html
# define user interface object
ui <- fluidPage(
  *Input(inputId = myinput, label = mylabel, ...)
  *Output(outputId = myoutput, ...)
)

# define server() function
server <- function(input, output){
  output$myoutput <- render*({
    # code to build the output.
    # If it uses an input value (input$myinput),
    # the output will be rebuilt whenever
    # the input value changes
  })}

# call to shinyApp() which returns the Shiny app
shinyApp(ui = ui, server = server)
Launch the Shiny app
5 Examples
- Telephones by region: https://shiny.rstudio.com/gallery/telephones-by-region.html
- Histogram of randomly generated numbers: https://shiny.rstudio.com/gallery/single-file-shiny-app.html
Create and launch the following app:
Histogram of randomly generated numbers: https://shiny.rstudio.com/gallery/single-file-shiny-app.html
To do that, first create the app.R file with the
following code:
# Global variables can go here
n <- 200


# Define the UI
ui <- bootstrapPage(
  numericInput('n', 'Number of obs', n),
  plotOutput('plot')
)


# Define the server code
server <- function(input, output) {
  output$plot <- renderPlot({
    hist(runif(input$n))
  })
}

# Return a Shiny app object
shinyApp(ui = ui, server = server)
Then, launch the app by clicking the Run App button in
RStudio or with shiny::runApp("appdir_path")
6 *Output()
and render*() functions
https://shiny.rstudio.com/tutorial/written-tutorial/lesson4/
We create reactive output with a two step process:
- Add an R object to the user interface.
- Tell Shiny how to build the object in the
server()function. The object will be reactive if the code that builds it calls the input value of the object.
Examples of functions:
- Text:
textOutput(),renderText() - Plot:
plotOutput(),renderPlot() - Table:
tableOutput(),renderTable() - DataTable:
dataTableOutput(),renderDataTable() - Image:
imageOutput(),renderImage()
Create an app that greets the user by name.
library(shiny)

ui <- fluidPage(
  textInput("name", "What's your name?"),
  textOutput("greeting")
)

server <- function(input, output, session) {
  output$greeting <- renderText({
    ...
  })
}

shinyApp(ui, server)
Solution:
paste("Hello ", input$name)
Build an app that allows the user to set a number x
between 1 and 50, and displays the result of multiplying this number by
5.
library(shiny)

ui <- fluidPage(
  sliderInput("x", label = "If x is", min = 1, max = 50, value = 30),
  textOutput("product")
)

server <- function(input, output, session) {
  output$product <- renderText({
    ...
  })
}

shinyApp(ui, server)
Solution:
paste(input$x, "x 5 is", input$x * 5)
7 Layout
https://shiny.rstudio.com/articles/layout-guide.html
fluidPage()creates a display that automatically adjusts to the dimensions of the browser window- Sidebar layout:
titlePanel()andsidebarLayout(sidebarPanel(), mainPanel()) - Grid layout:
fluidRow(column(), column(), ...). Column widths are based on 12-wide grid system, so should add up to 12 within afluidRow()container. - Tabsets:
tabsetPanel() - Navlists:
navlistPanel(). This presents the various components as a sidebar list rather than using tabs - Navbar pages:
navbarPage(). Multi-page user interface that includes a navigation bar
- Build a Shiny app with a grid layout that contains a row with two
columns containing two plots, each column taking half the app. In the
code below, substitute
...by the appropriate syntax.
library(shiny)

ui <- fluidPage(
  fluidRow(
    ...,
    ...
  )
)
server <- function(input, output, session) {
  output$plot1 <- renderPlot(plot(1:5))
  output$plot2 <- renderPlot(plot(1:5))
}

shinyApp(ui, server)
Solution:
8 HTML content
https://shiny.rstudio.com/tutorial/written-tutorial/lesson2/
https://shiny.rstudio.com/articles/tag-glossary.html
Telephones by region: https://shiny.rstudio.com/gallery/telephones-by-region.html
Create file
app.Rwithuiandserver()and launch the appIn the main panel, include a text that says
paste("This plot corresponds to region", input$region, ".")In the main panel, include a table with
WorldPhones
Solution:
- In
uiincludetextOutput("outputtext"),. Inserver()includeoutput$outputtext <- renderText({...}) - In
uiincludetableOutput("outputtable"),. Inserver()includeoutput$outputable <- renderTable({...}) - https://www.paulamoraga.com/book-r/shinyexercises/shiny-telephones.R
Modify the following Shiny app so plot has height 300px and width
700px. ?plotOutput
library(shiny)

ui <- fluidPage(
  plotOutput("plot")
)

server <- function(input, output, session) {
  output$plot <- renderPlot(plot(1:5))
}

shinyApp(ui, server)
Solution:
plotOutput("plot", width = "700px", height = "300px")
Modify the following Shiny app so datatable includes
options = list(pageLength = 5).
?renderDataTable
library(shiny)

ui <- fluidPage(
  dataTableOutput("table")
)
server <- function(input, output, session) {
  output$table <- renderDataTable(mtcars)
}

shinyApp(ui, server)
Solution:
output$table <- renderDataTable(mtcars, options = list(pageLength = 5))
9 Examples
datatable()andnavbarPage(): https://shiny.rstudio.com/gallery/datatables-options.htmlconditionalPanel(): https://shiny.rstudio.com/gallery/faithful.html
- https://shiny.rstudio.com/gallery/datatables-options.html
- Add another
tabPanel()showing only the first two columns ofiris
Solution:
10 *Input()
functions
Shiny widget gallery: https://shiny.rstudio.com/gallery/widget-gallery.html
checkboxInput()dateInput()fileInput()numericInput()radioButtons()selectInput()sliderInput()textInput()
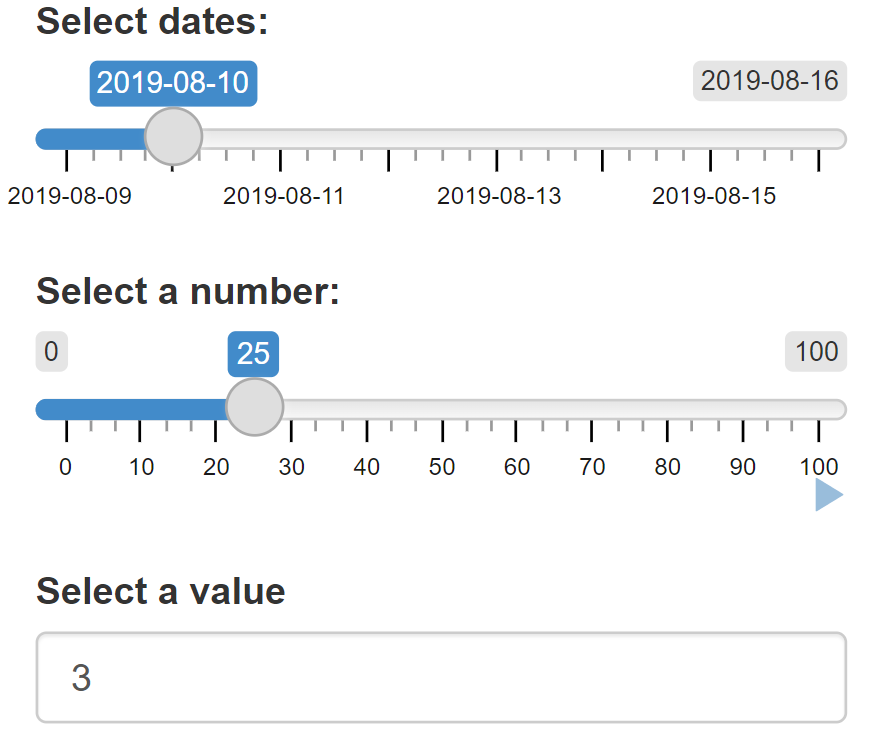
Build a Shiny app containing the following inputs
Slider input with label
"Select dates:", minimum date"2019-08-09", maximum date"2019-08-16", and initial value"2019-08-10".Slider input to select values between 0 and 100 where the interval between each selectable value on the slider is 5. Then, add animation to the input widget so when the user presses play the input widget scrolls through automatically.
Numeric input box where the user can enter any value between 0 and 1000. Initial value 150 and step 50. What is the purpose of the step argument in this widget?
Solution:
library(shiny)

ui <- fluidPage(
  sliderInput("dates", "Select dates:", min = as.Date("2019-08-09"), max = as.Date("2019-08-16"),
              value = as.Date("2019-08-10")),
  sliderInput("number", "Select a number:", min = 0, max = 100, value = 0, step = 5, animate = TRUE),
  numericInput("number", "Select a value", value = 150, min = 0, max = 1000, step = 50)
)

server <- function(input, output, session) {

}

shinyApp(ui, server)
The step argument is the amount by which the numericInput value is incremented (resp. decreased) when the user clicks the up (resp. down) arrow. When the user clicks the up (resp. down) arrow the numeric value will increase (resp. decrease) by 50. Note: by using a numericInput the user still has the ability to type any number.
11 Uploads and Downloads
https://mastering-shiny.org/action-transfer.html
We can create a file upload control that can be used to upload one or more files.
https://shiny.rstudio.com/reference/shiny/0.14/fileInput.html
ui <- fluidPage(
  sidebarLayout(
    sidebarPanel(
      fileInput("file1", "Choose CSV File",
        accept = c(
          "text/csv",
          "text/comma-separated-values,text/plain",
          ".csv")
        ),
      tags$hr(),
      checkboxInput("header", "Header", TRUE)
    ),
    mainPanel(
      tableOutput("contents")
    )
  )
)

server <- function(input, output) {
  output$contents <- renderTable({
    # input$file1 will be NULL initially. After the user selects
    # and uploads a file, it will be a data frame with 'name',
    # 'size', 'type', and 'datapath' columns. The 'datapath'
    # column will contain the local filenames where the data can
    # be found.
    inFile <- input$file1

    if (is.null(inFile))
      return(NULL)

    read.csv(inFile$datapath, header = input$header)
  })
}

shinyApp(ui, server)
We can download content from a Shiny application to be made available to the user as file downloads.
- Create a download button with
downloadButton()or download link withdownloadLink() - The filename and contents are specified by
downloadHandler()in the server function
https://shiny.rstudio.com/reference/shiny/0.14/downloadHandler.html
ui <- fluidPage(
  downloadLink("downloadData", "Download")
)

server <- function(input, output) {
  # Our dataset
  data <- mtcars

  output$downloadData <- downloadHandler(
    filename = function() {
      paste("data-", Sys.Date(), ".csv", sep = "")
    },
    content = function(file) {
      write.csv(data, file)
    }
  )
}

shinyApp(ui, server)
12 Reactive expressions
- A reactive expression takes input values, or values from other
reactive expressions, and returns a new value. Create reactive
expressions with
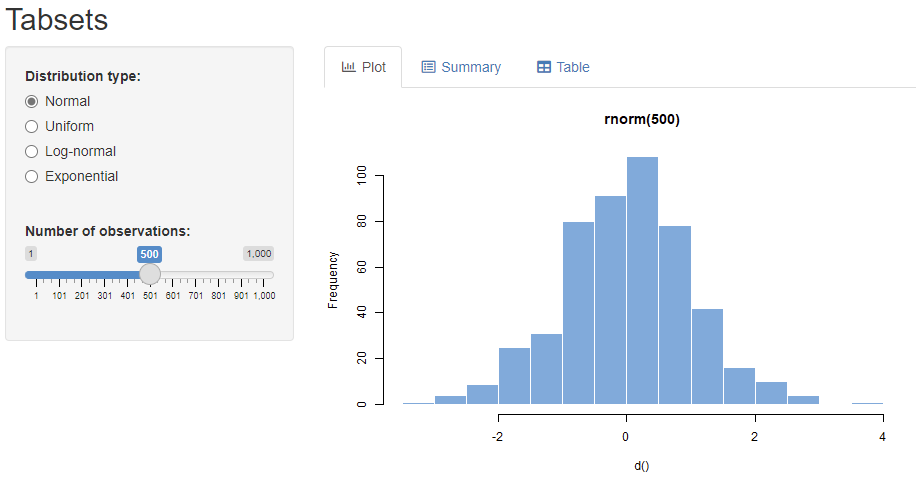
reactive({ }). Call reactive expressions with the name of the expression followed by(). Only call reactive expressions from within other reactive expressions orrender*()functions - https://shiny.rstudio.com/tutorial/written-tutorial/lesson6/
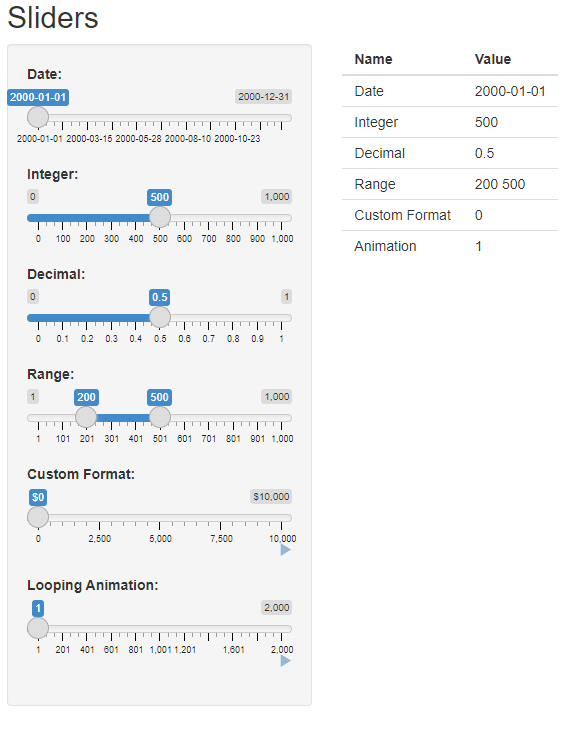
- Sliders: https://shiny.rstudio.com/gallery/sliders.html
- Reactive expression: https://shiny.rstudio.com/gallery/tabsets.html
13 Checking for required
values with req()
https://shiny.rstudio.com/articles/req.html
- Sliders: https://shiny.rstudio.com/gallery/sliders.html
- Add slider with dates from 1st January 2000 to 31st December 2000. Add date in the table
Solution:
`
14 Including icons with
icon()
https://shiny.rstudio.com/reference/shiny/0.14/icon.html
https://fontawesome.com/v4/icons/
Create a Shiny app that includes icons. For example, in
ui include the following icon with 3x normal size:
icon("table", class = "fa-3x", lib = "font-awesome")
Consider the following app with 3 tabs. Add the following icons to
each of the tabs by using the icon argument of
tabPanel():
https://shiny.rstudio.com/gallery/tabsets.html
tabPanel("Plot", icon = icon("bar-chart-o")),
tabPanel("Summary", icon = icon("list-alt")),
tabPanel("Table", icon = icon("table"))
Solution:
15 Including icons with
the fontawesome package
17 Interactive dashboards with flexdashboard and Shiny
Flexdashboard: https://www.paulamoraga.com/book-geospatial/sec-flexdashboard.html
Flexdashboard and Shiny: https://www.paulamoraga.com/book-geospatial/sec-dashboardswithshiny.html
Flexdashboard and Shiny: https://rstudio.github.io/flexdashboard/articles/shiny.html
The shinydashboard package provides another way to
create dashboards with Shiny: https://rstudio.github.io/shinydashboard/
- Create a dashboard with flexdashboard and Shiny. Deploy the dashboard to shinyapps.io
18 Building a Shiny app to upload and visualize spatio-temporal data
https://www.paulamoraga.com/book-geospatial/sec-shinyexample.html
19 Practice
Use ggplot2 to create the plots of the following Shiny
apps:
- Telephones by region: https://shiny.rstudio.com/gallery/telephones-by-region.html
- Histogram of randomly generated numbers: https://shiny.rstudio.com/gallery/single-file-shiny-app.html
Solution:
Explore some of the Shiny apps in the gallery and replicate some of their functionality.