ggplot2 - exercises
Solutions: https://www.paulamoraga.com/book-r/99-problems-ggplot2-practice-solutions.html
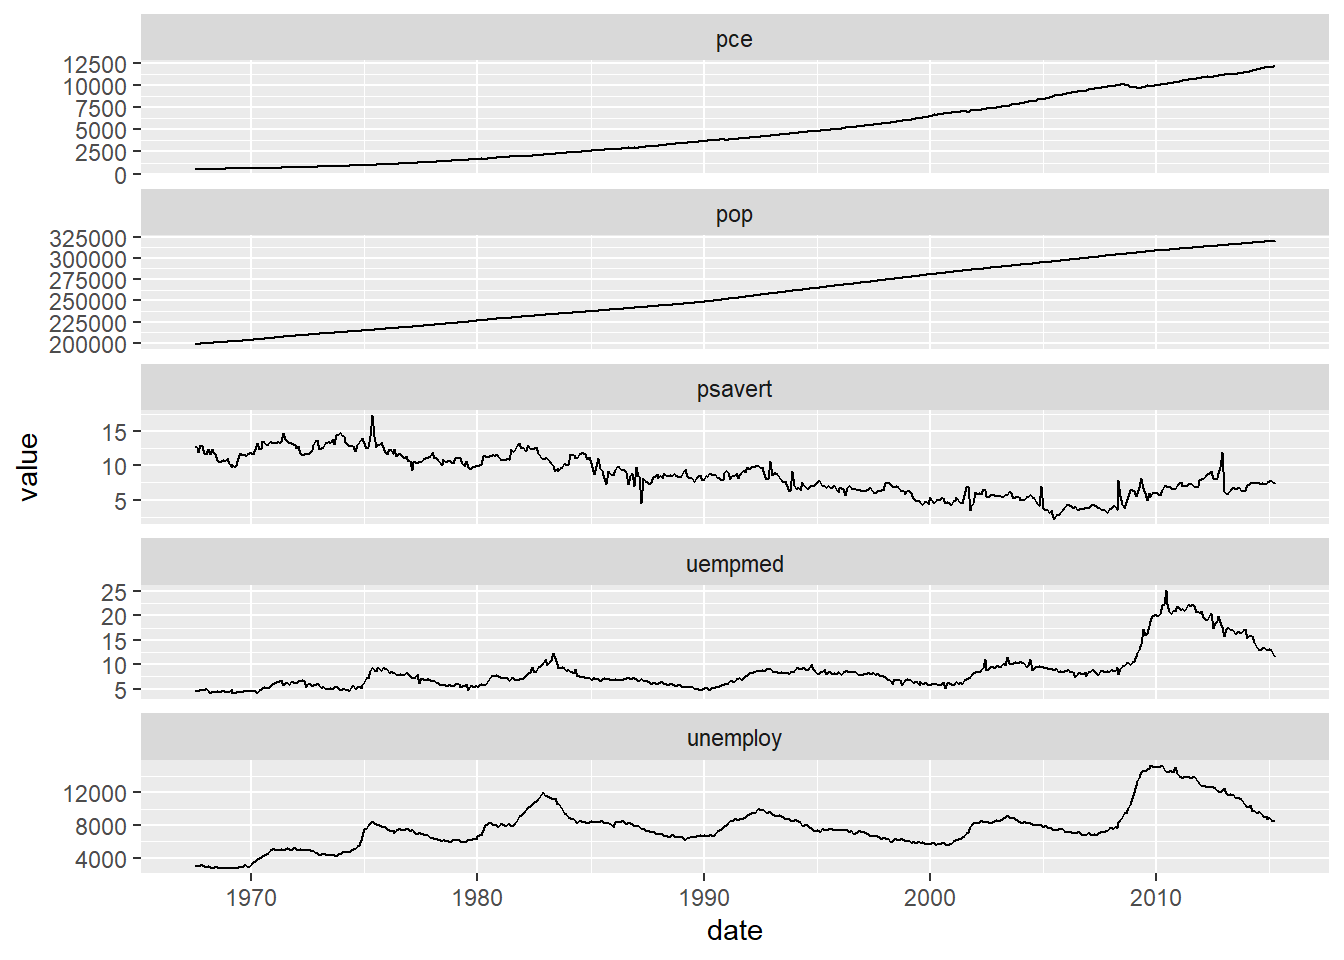
1 Facets
Dataset ggplot2::economics_long. Variables
date, value, variable.
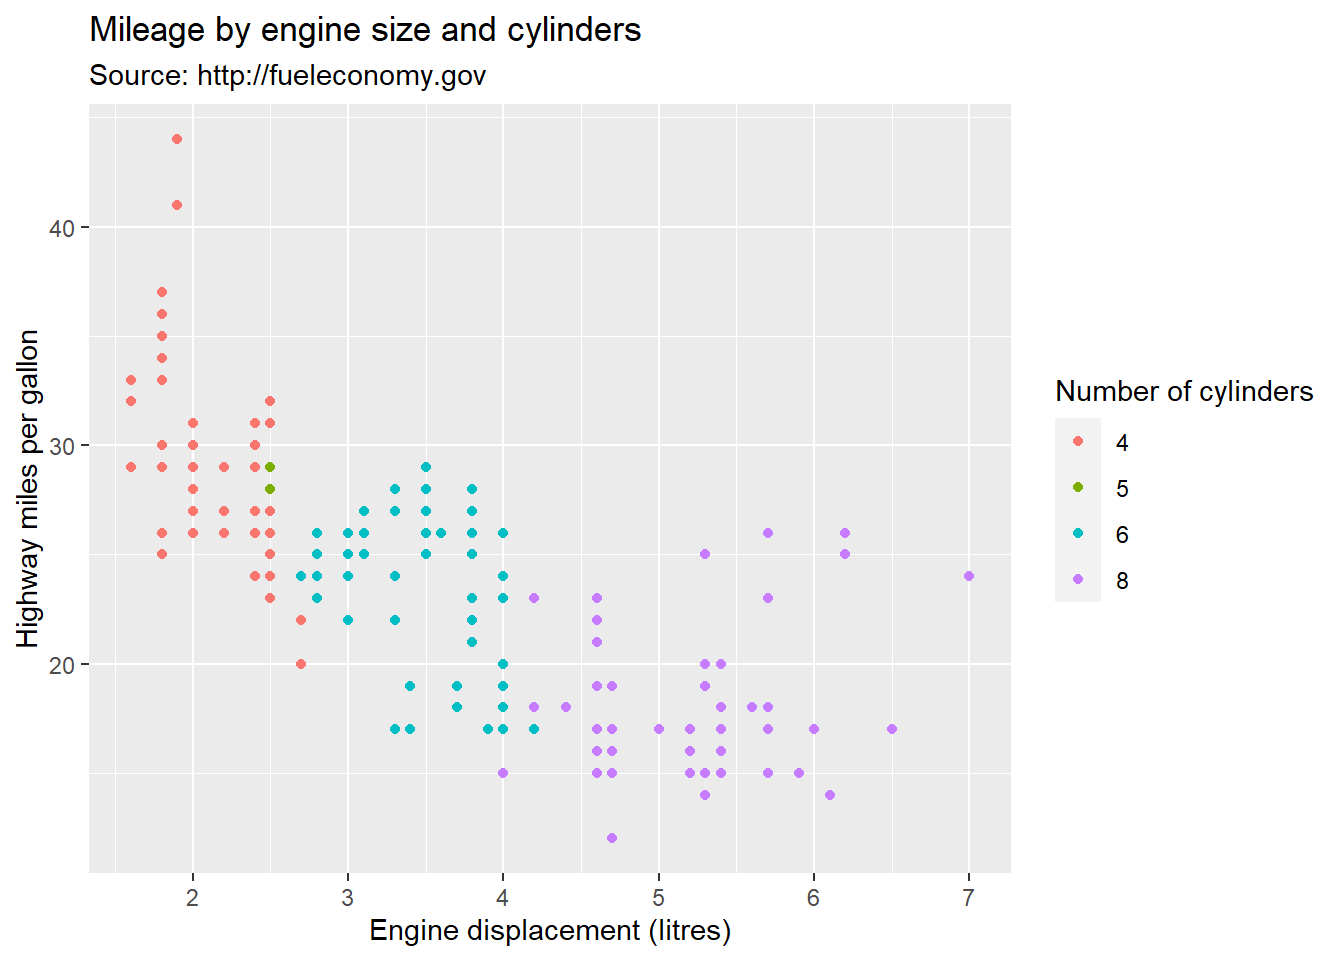
2 Labels
Dataset ggplot2::mpg. Variables displ,
hwy, cyl.
3 Boxplot
geom_gitter()to add a small amount of random variation to the location of each pointhrbrthemesfor additional packages: https://hrbrmstr.github.io/hrbrthemes/
library(tidyverse)
library(hrbrthemes)
library(viridis)

d <- data.frame(name = c(rep("A", 500), rep("B", 500), rep("B", 500), rep("C", 20), rep('D', 100)),
value = c(rnorm(500, 10, 5), rnorm(500, 13, 1), rnorm(500, 18, 1), rnorm(20, 25, 4), rnorm(100, 12, 1)))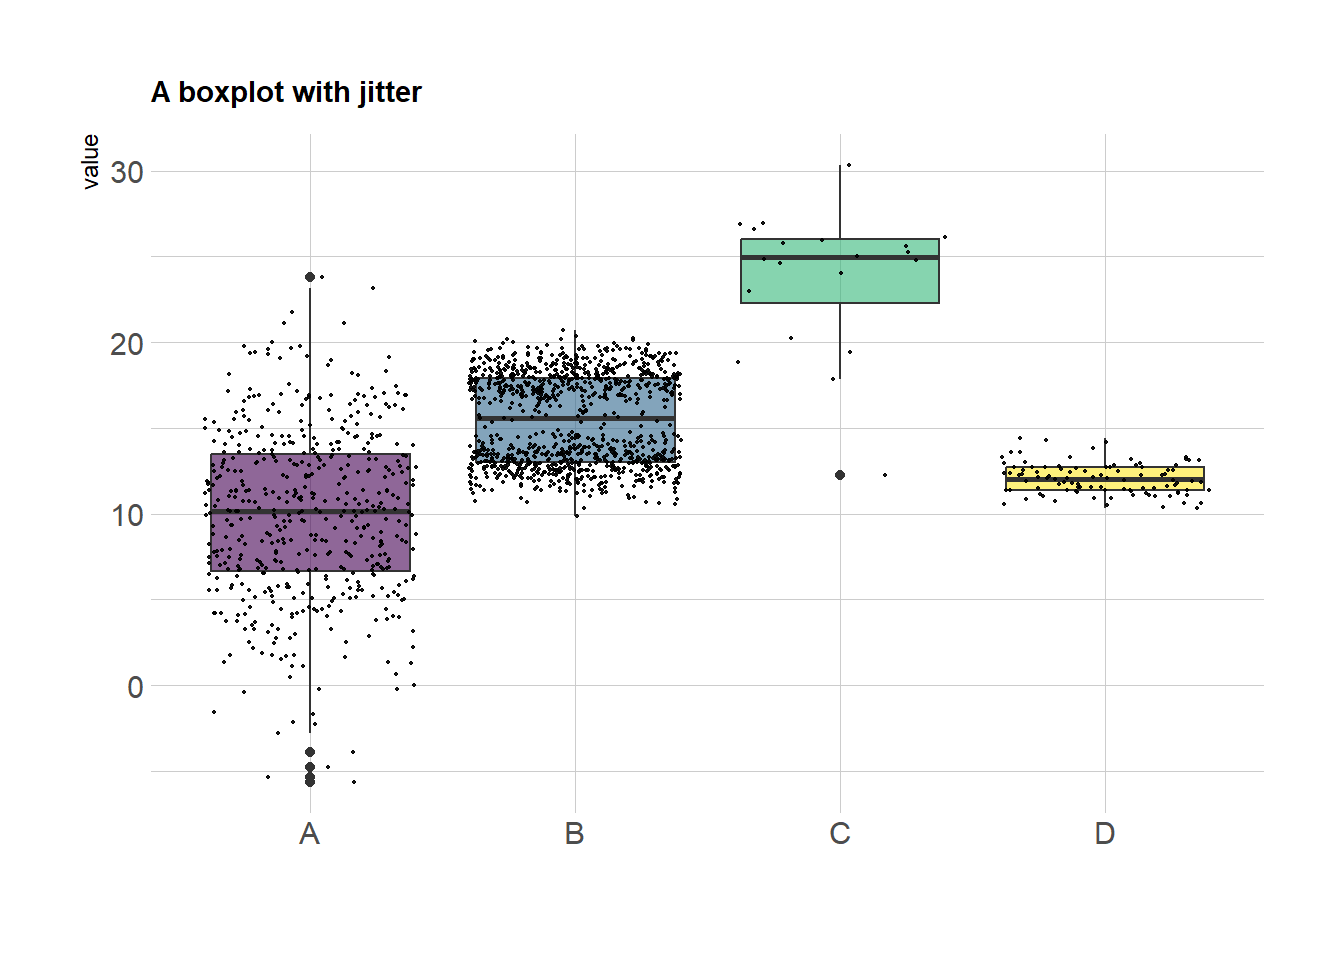
4 Make previous plots interactive with plotly::ggplotly()
5 gganimate
library(tidyverse)
library(viridis)
library(ggplot2)
library(gganimate)
library(babynames)
library(hrbrthemes)

# Keep only 3 names
d <- babynames %>% filter(name %in% c("Ashley", "Patricia", "Helen")) %>% filter(sex == "F")
library(ggplot2)
library(gganimate)
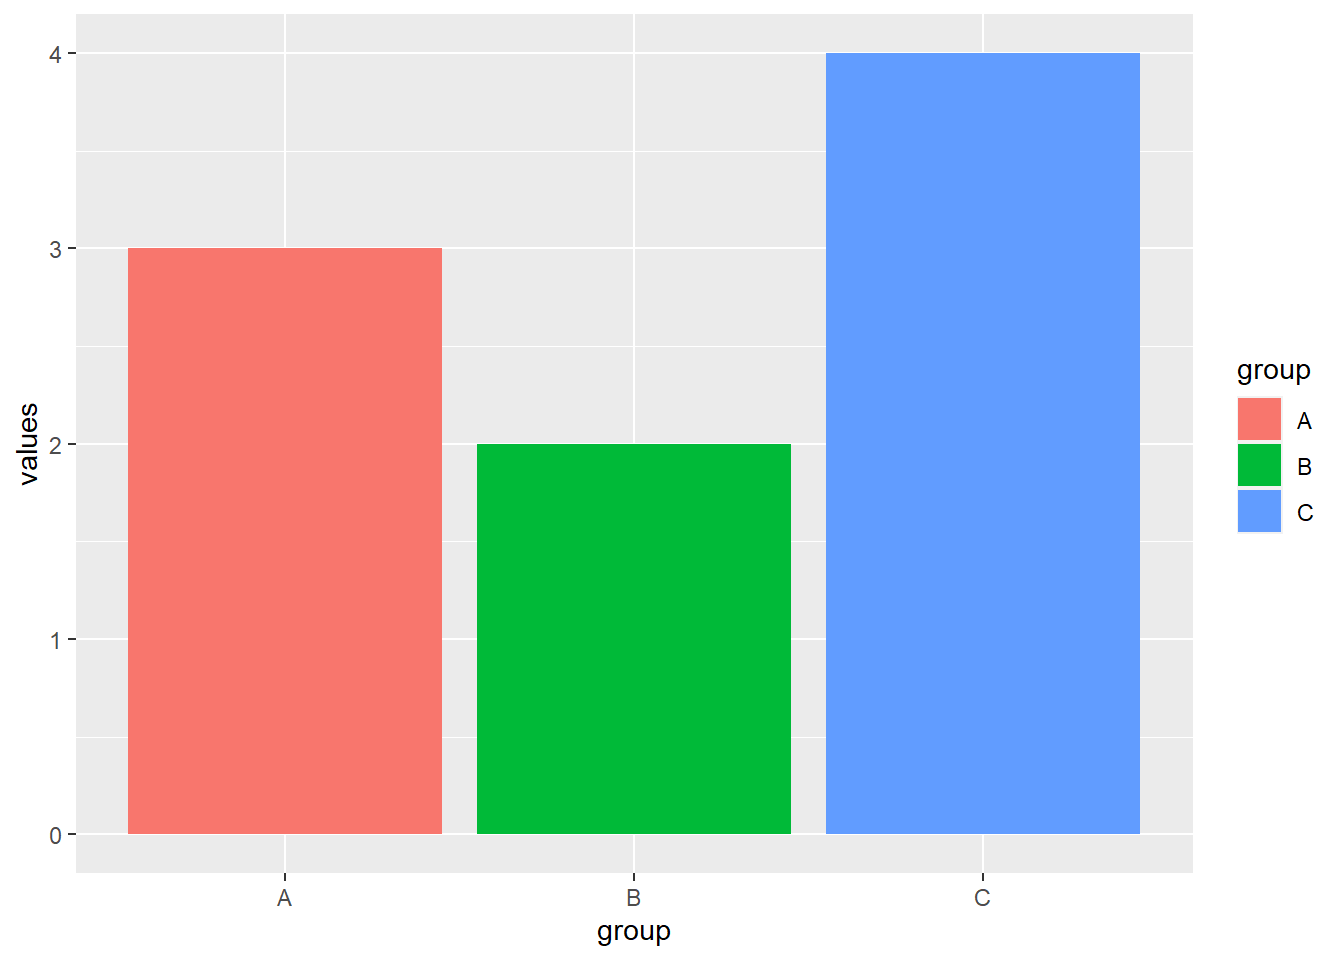
a <- data.frame(group = c("A","B","C"), values = c(3,2,4), frame = rep('a', 3))
b <- data.frame(group = c("A","B","C"), values = c(5,3,7), frame = rep('b', 3))
d <- rbind(a,b)
ggplot(a, aes(x = group, y = values, fill = group)) + geom_bar(stat = 'identity')