ggplot2 - aesthetics
Solutions: https://www.paulamoraga.com/book-r/99-problems-ggplot2-aesthetics-solutions.html
Dataset mtcars {datasets} contains data on fuel
consumption and 10 aspects of automobile design and performance for 32
automobiles
library(ggplot2)

p <- ggplot(mtcars, aes(wt, mpg))
p + geom_point()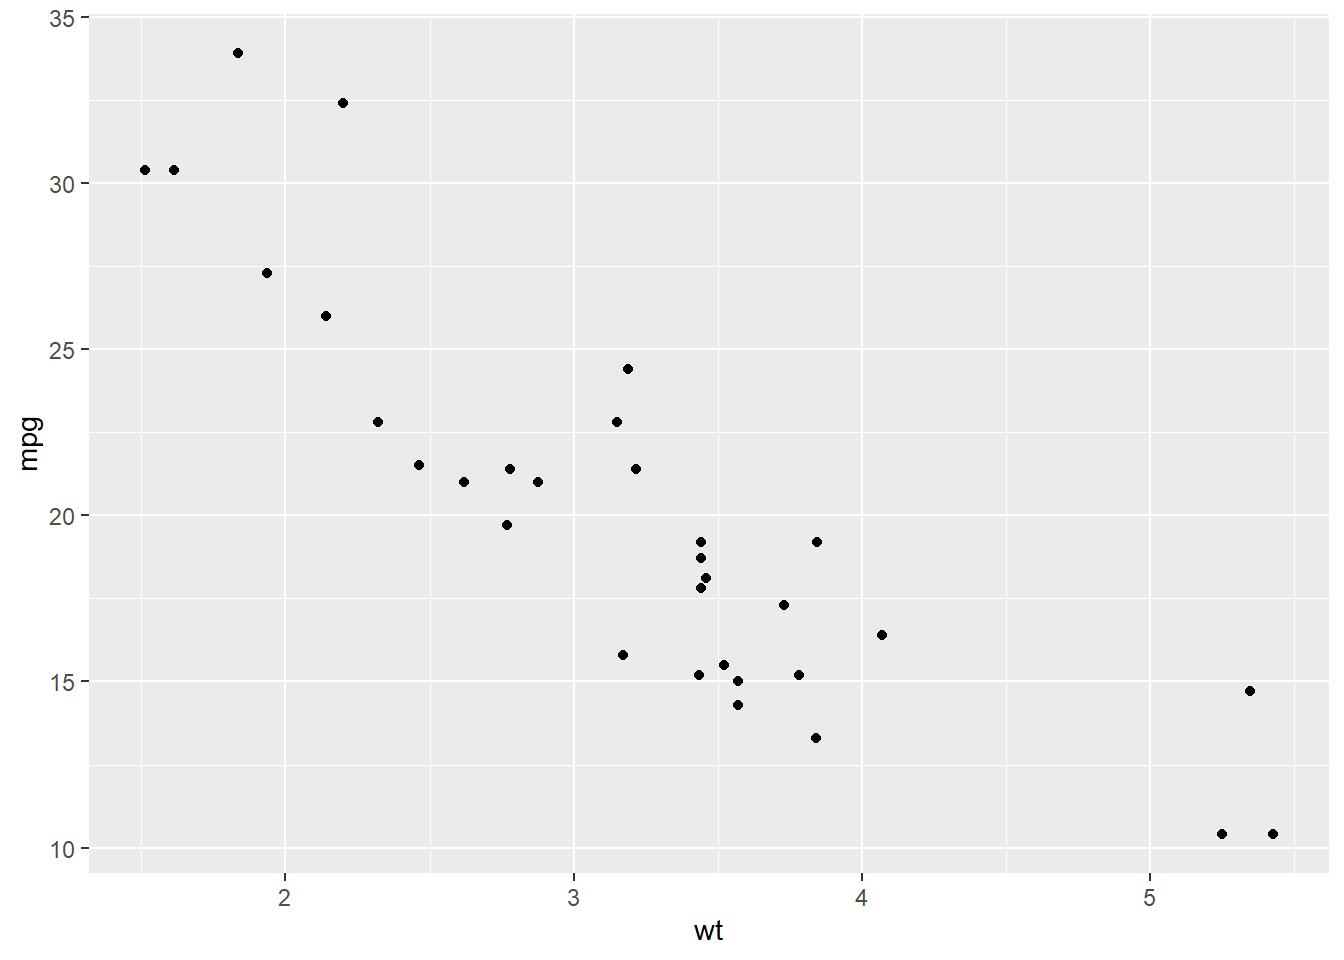
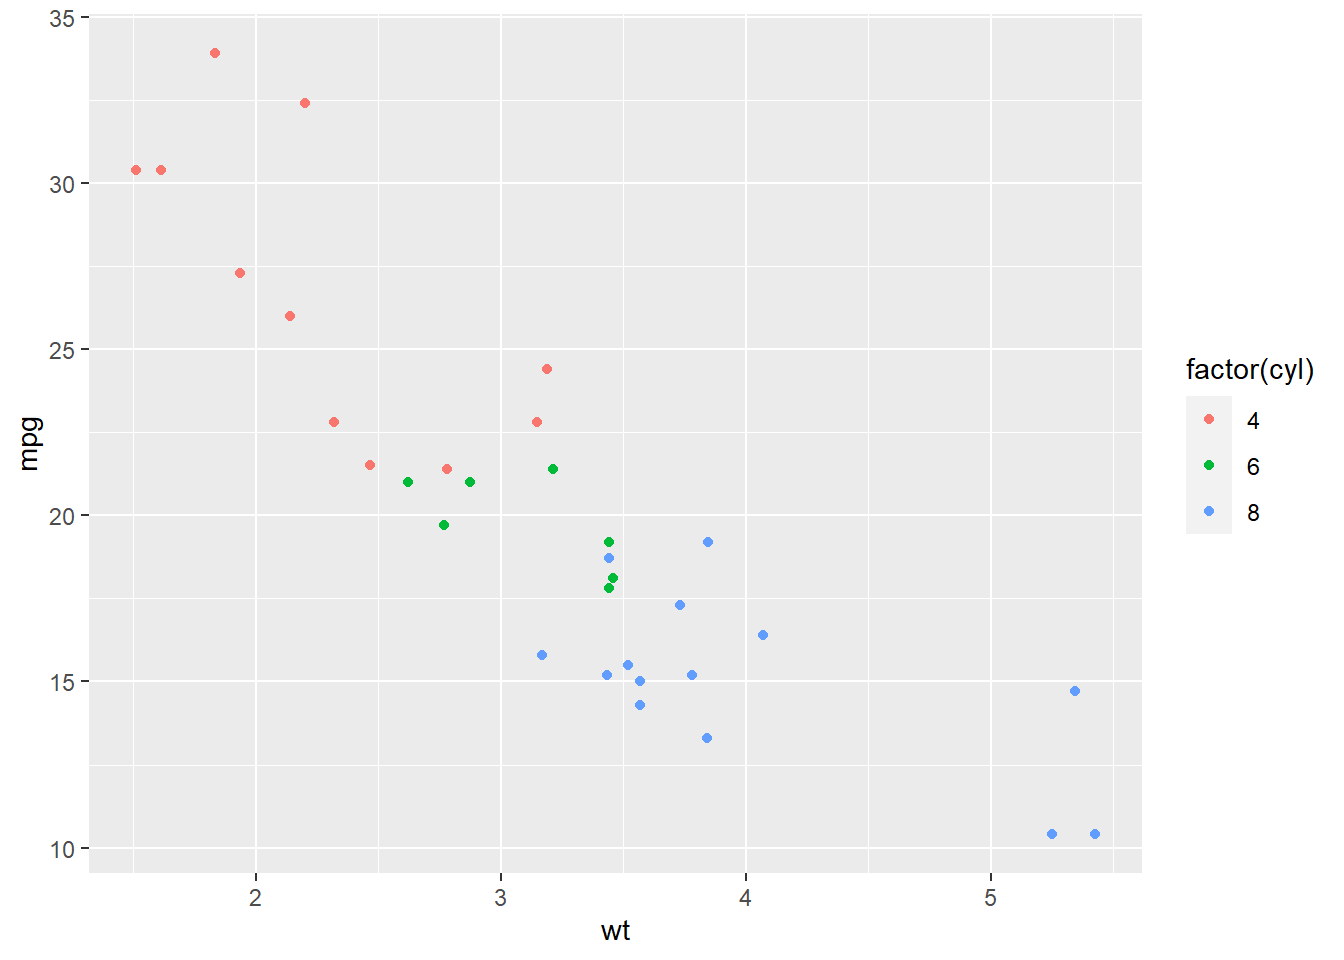
Add colour
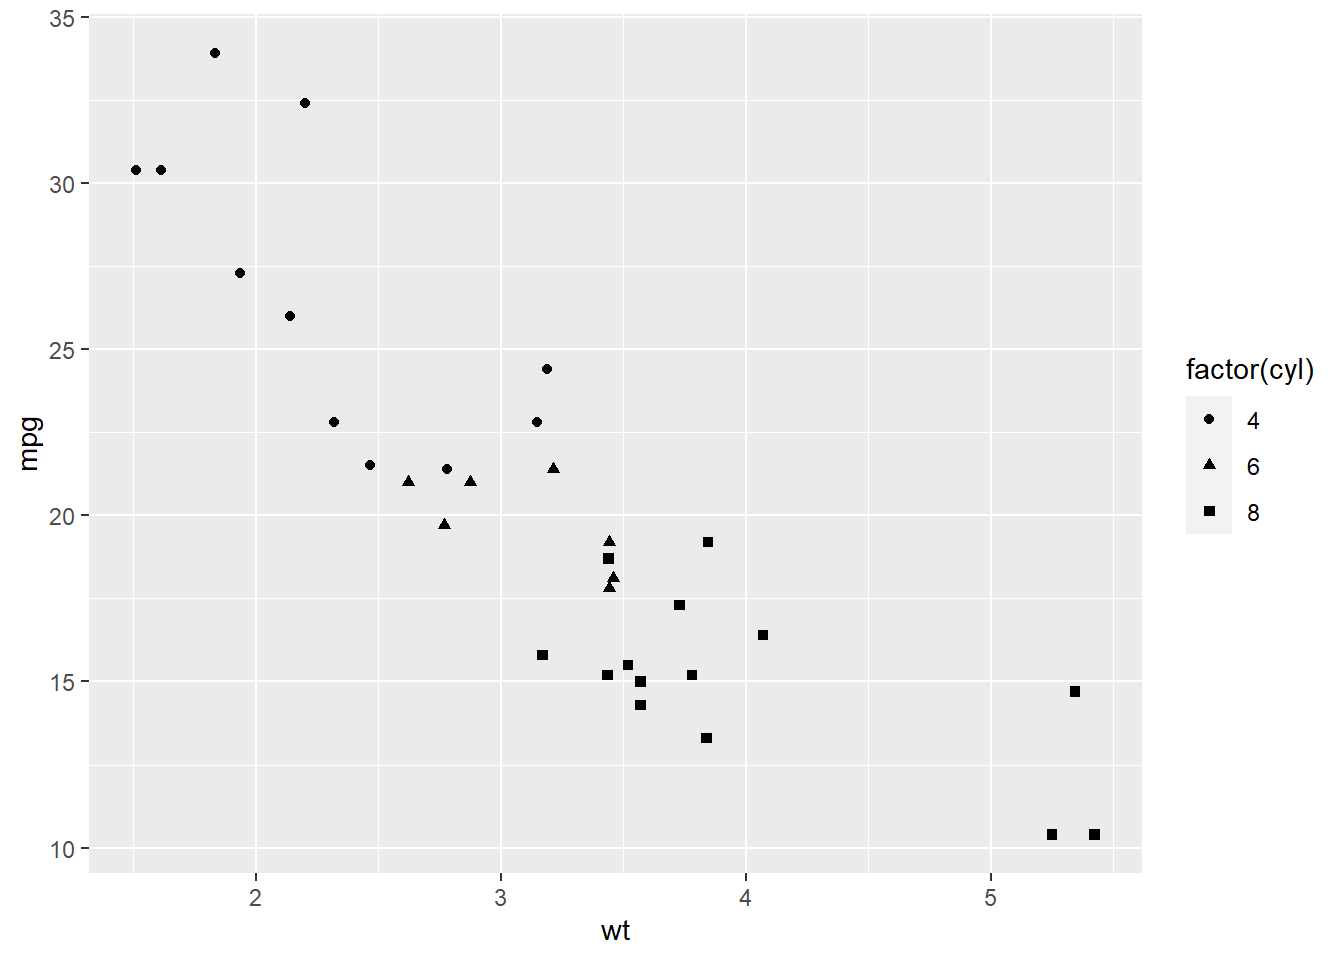
Changing shapes of data points
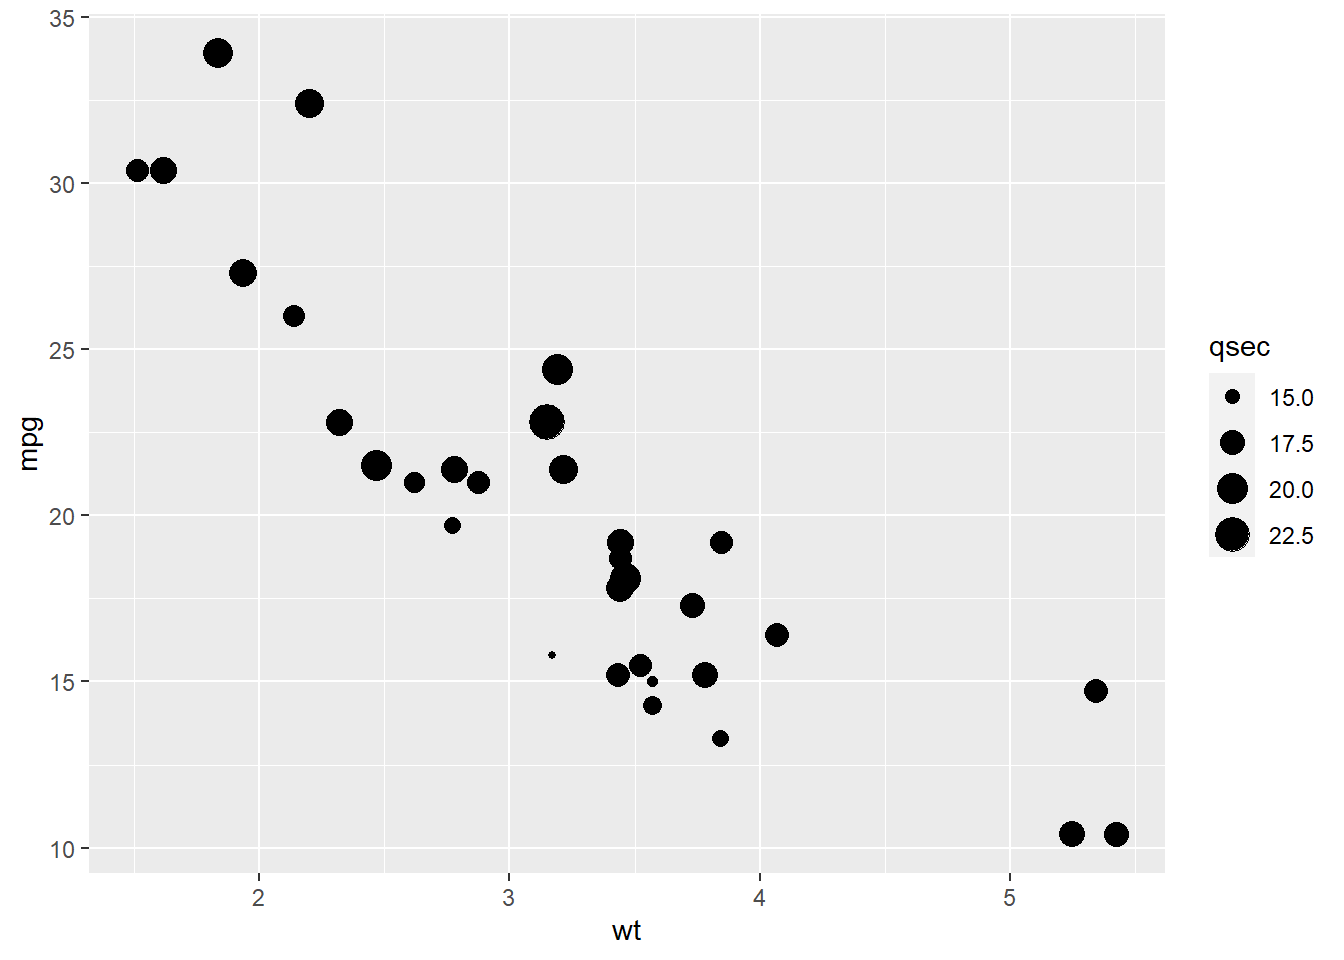
Changing size of data points
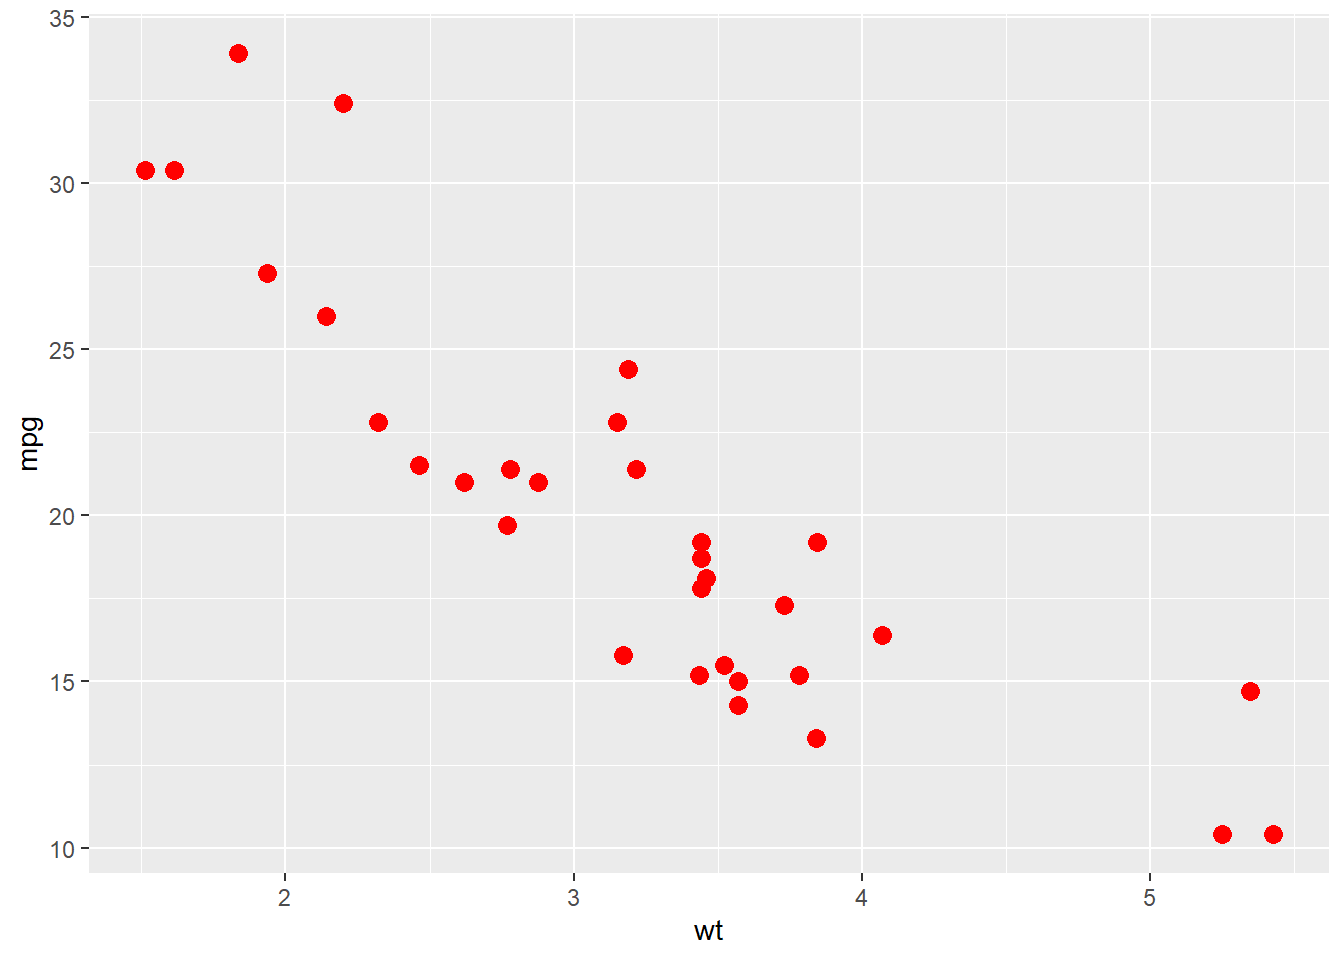
Manually setting aesthetics
Optional shape arguments
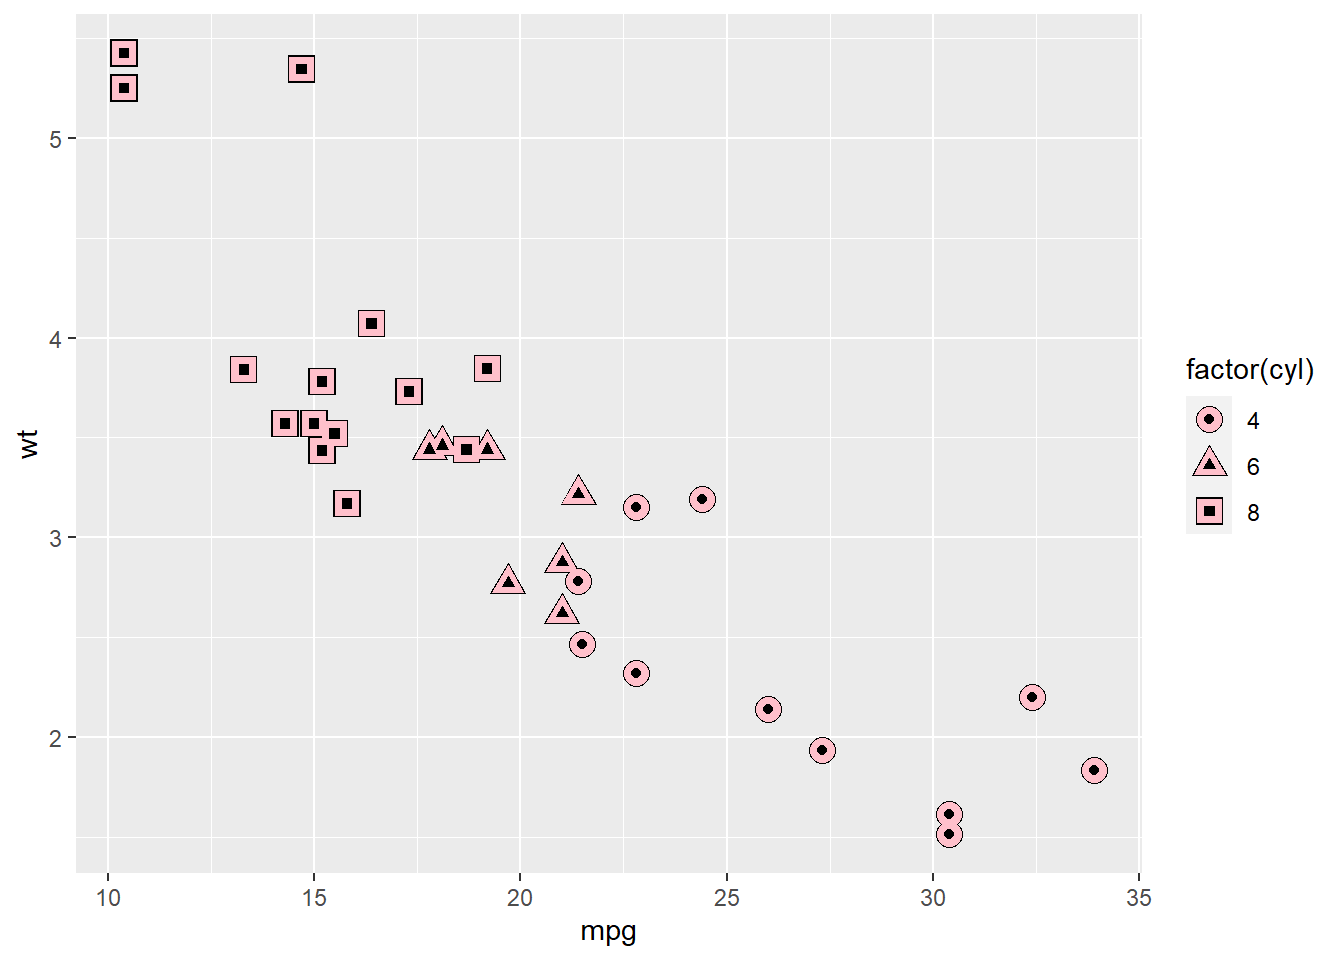
For shapes that have a border (like shape 21), you can colour the inside and outside separately. Use the stroke aesthetic to modify the width of the border.
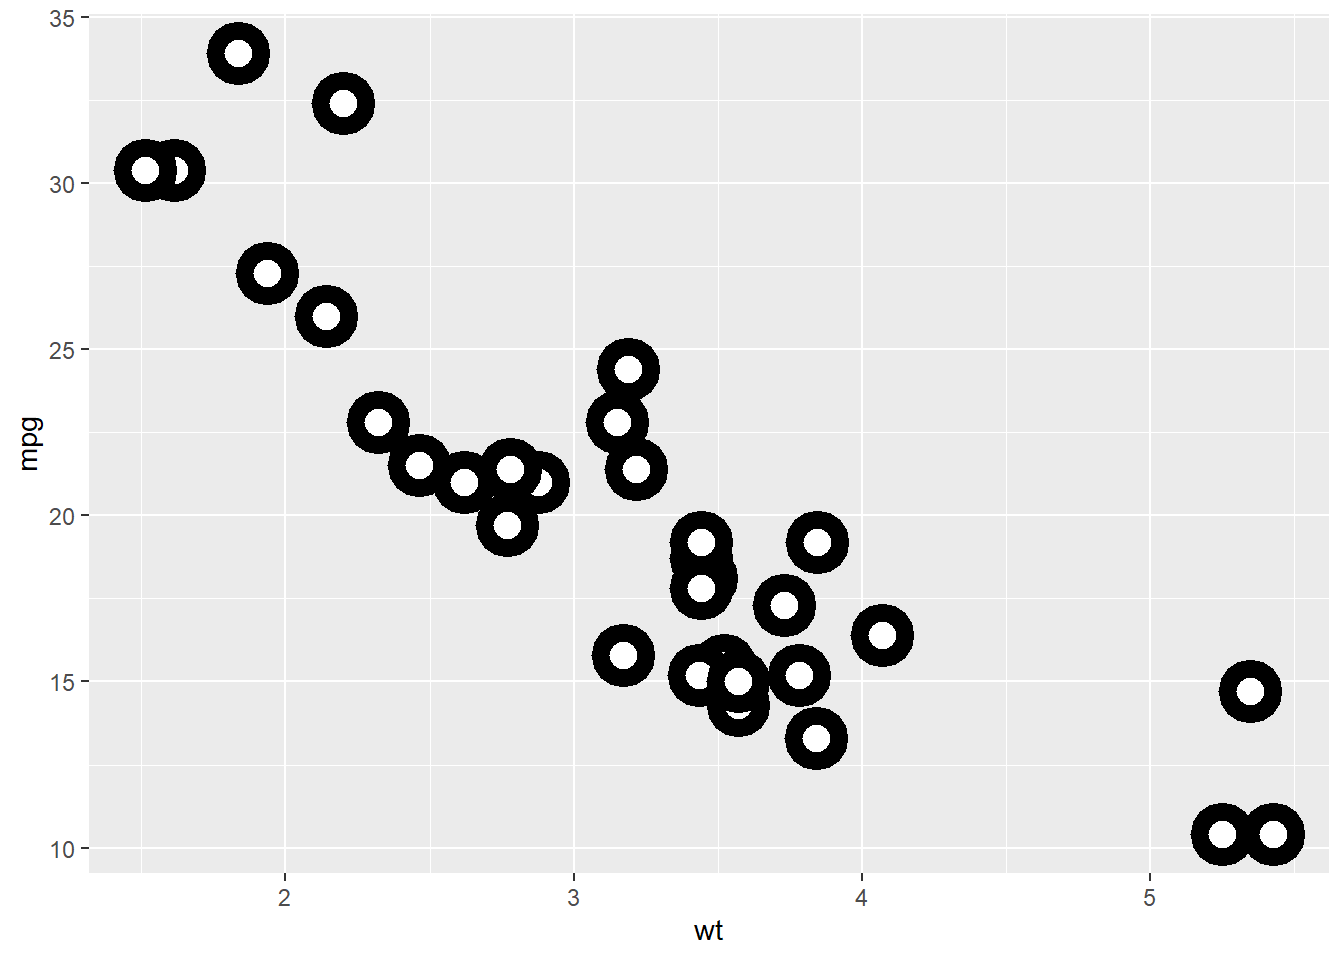
Mix multiples shapes
You can create interesting shapes by layering multiple points of different sizes.
Default plot
p <- ggplot(mtcars, aes(mpg, wt, shape = factor(cyl)))

p +
  geom_point(aes(colour = factor(cyl)), size = 4) +
  geom_point(colour = "grey90", size = 1.5)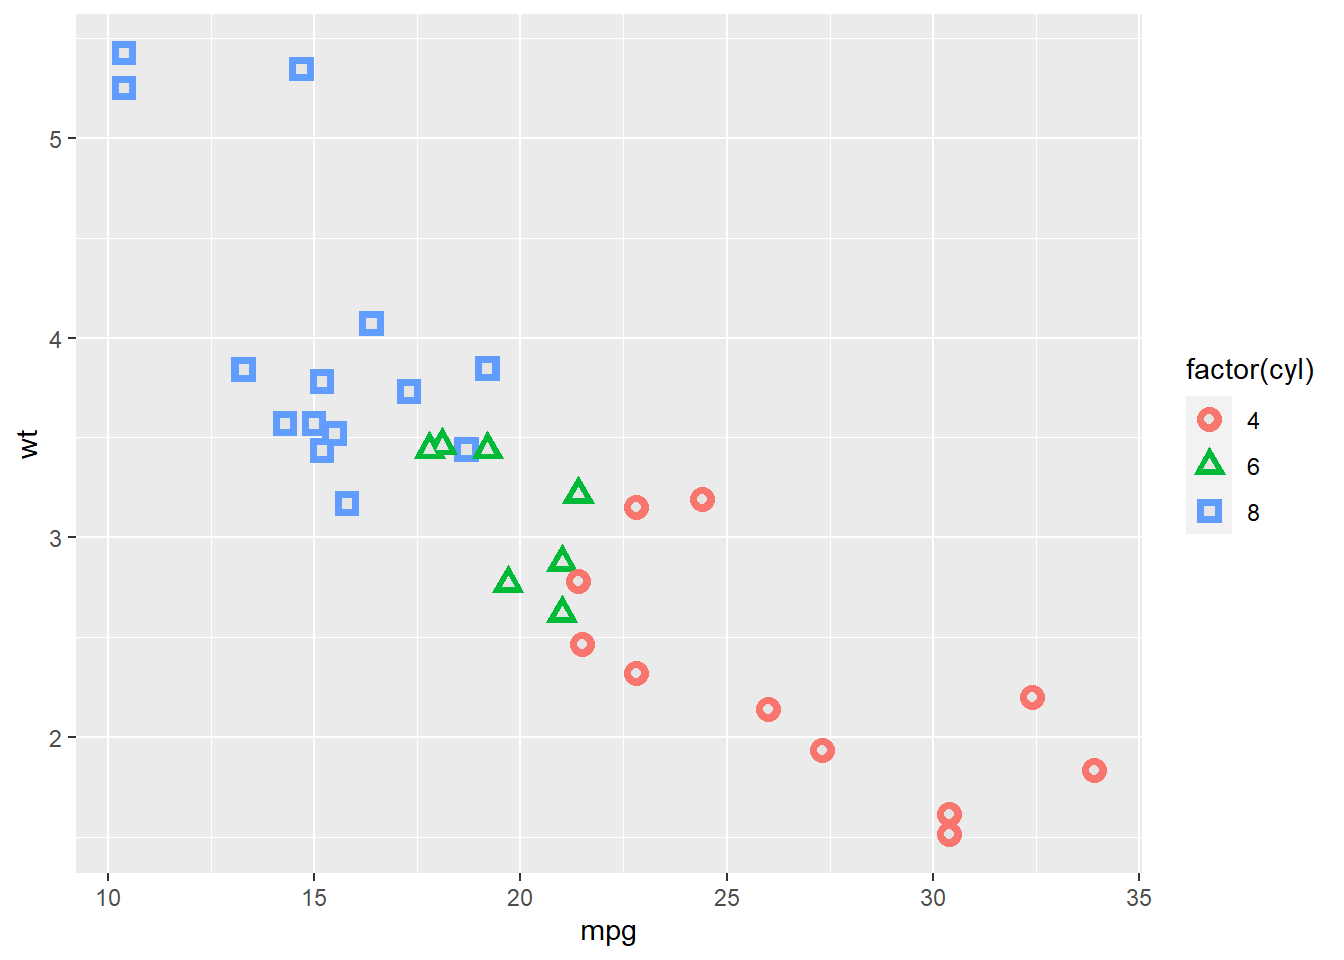
Mixed shapes