ggplot2 - aesthetics
Solutions: https://www.paulamoraga.com/book-r/99-problems-ggplot2-aesthetics-solutions.html
Dataset mtcars {datasets} contains data on fuel
consumption and 10 aspects of automobile design and performance for 32
automobiles
library(ggplot2)

p <- ggplot(mtcars, aes(wt, mpg))
p + geom_point()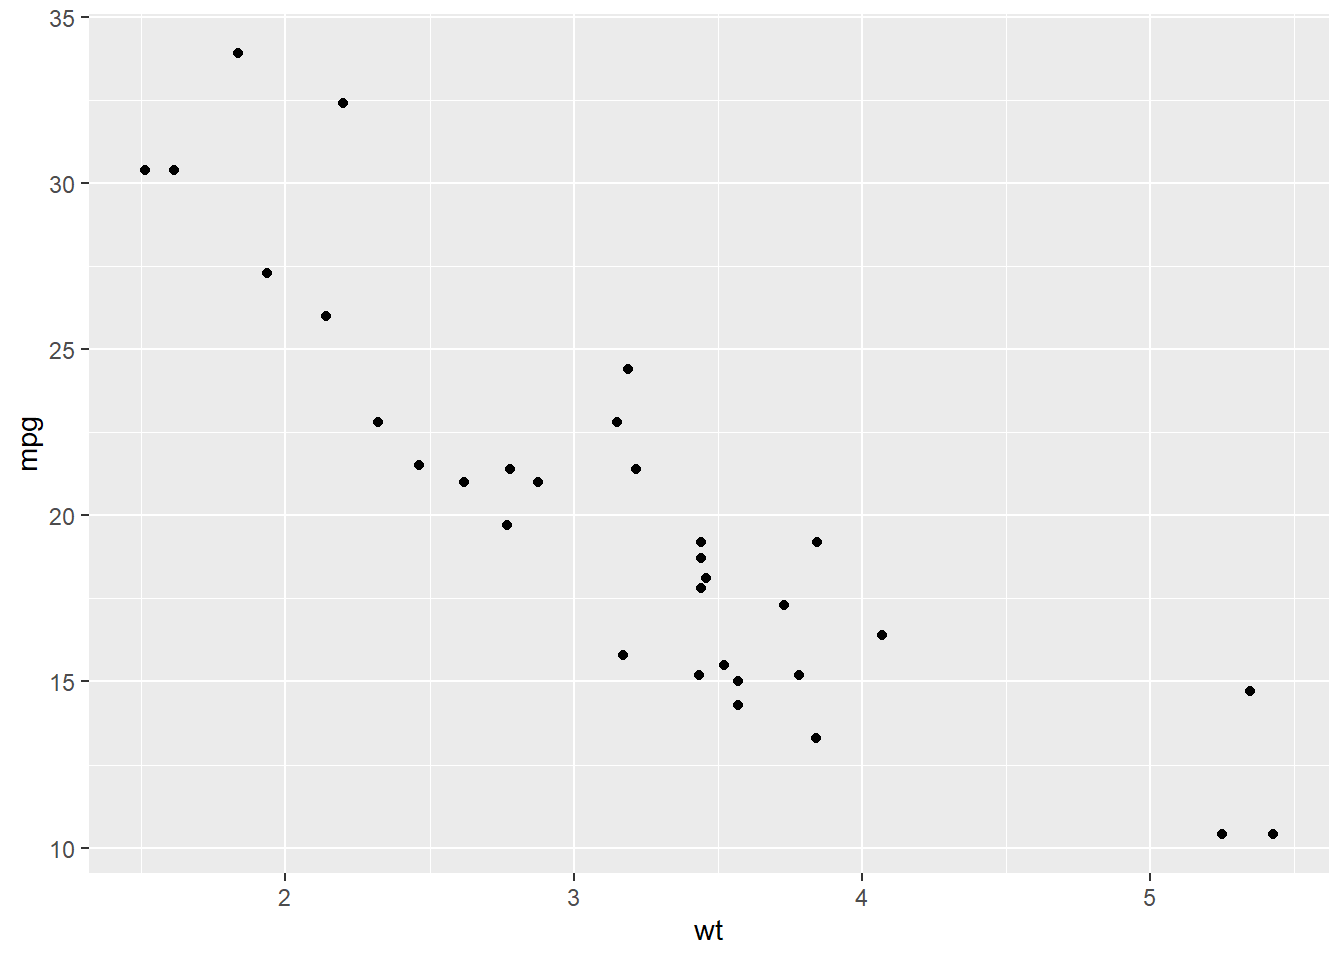
Add colour
p <- ggplot(mtcars, aes(wt, mpg))
p + geom_point(aes(colour = factor(cyl)))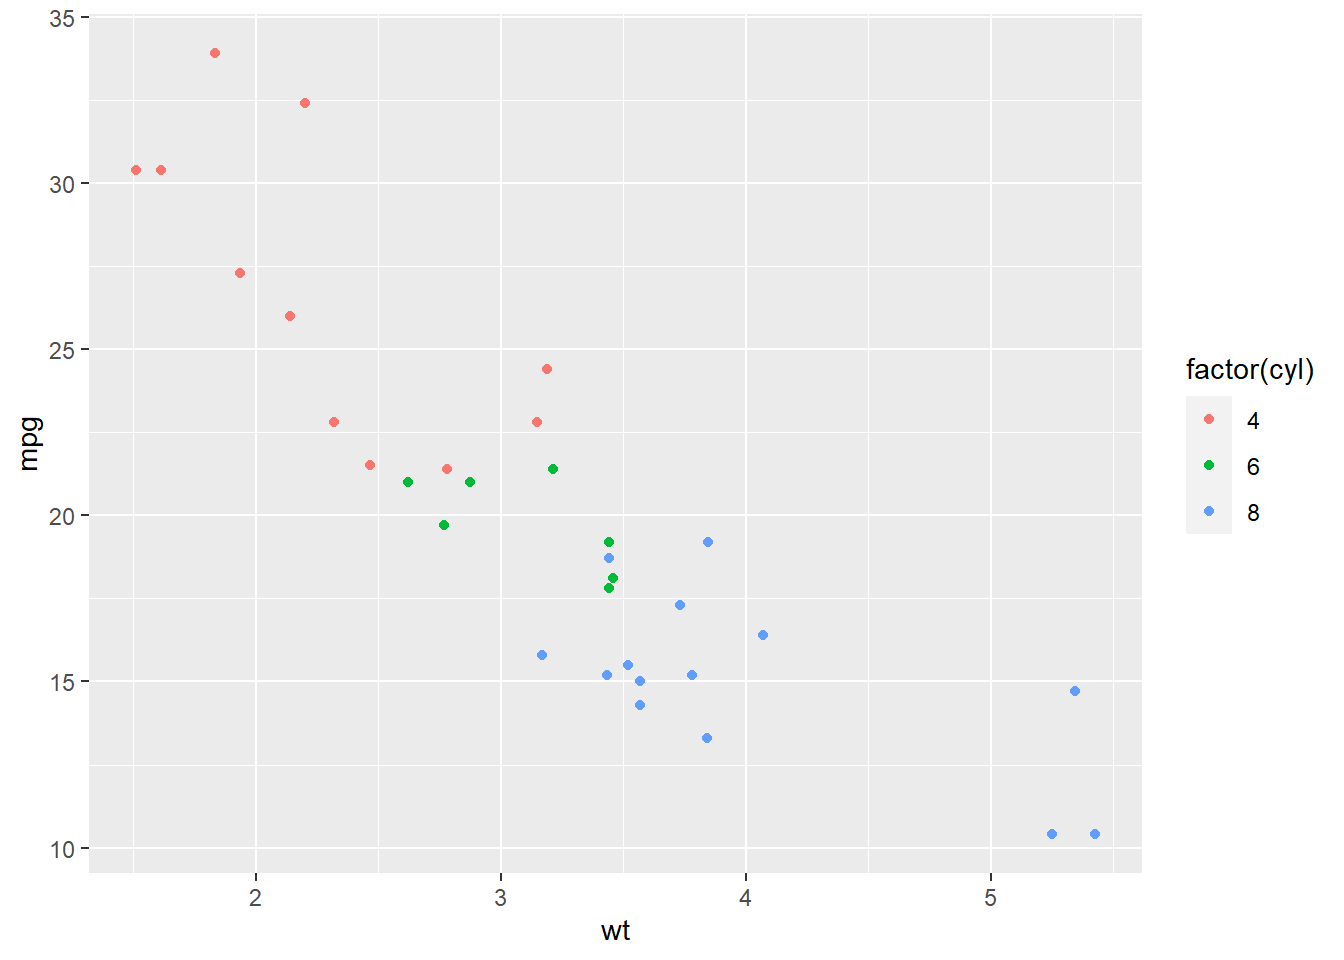
Changing shapes of data points
p <- ggplot(mtcars, aes(wt, mpg))
p + geom_point(aes(shape = factor(cyl)))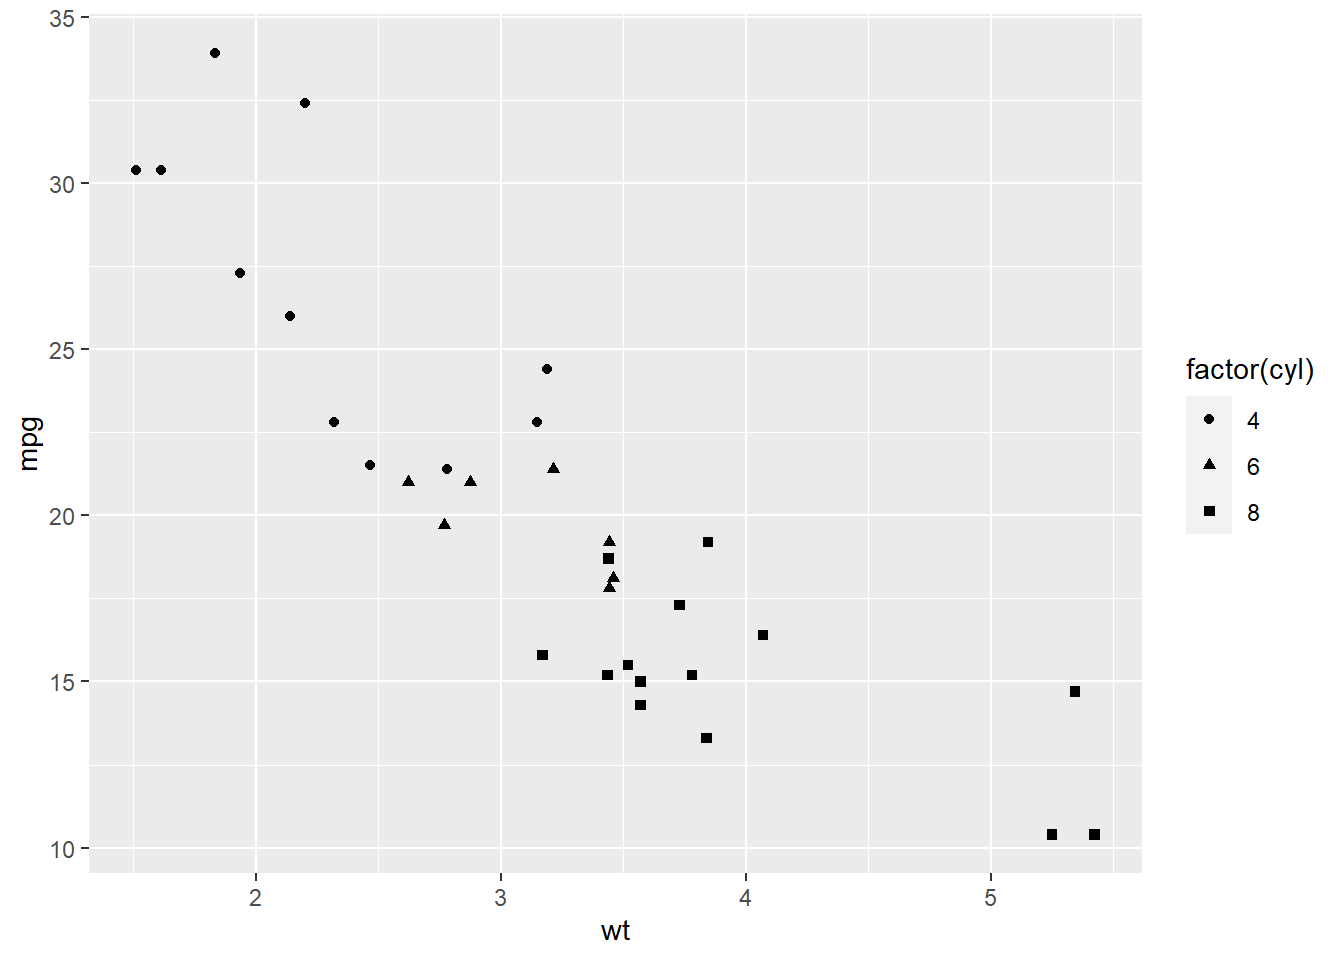
Changing size of data points
p <- ggplot(mtcars, aes(wt, mpg))
p + geom_point(aes(size = qsec))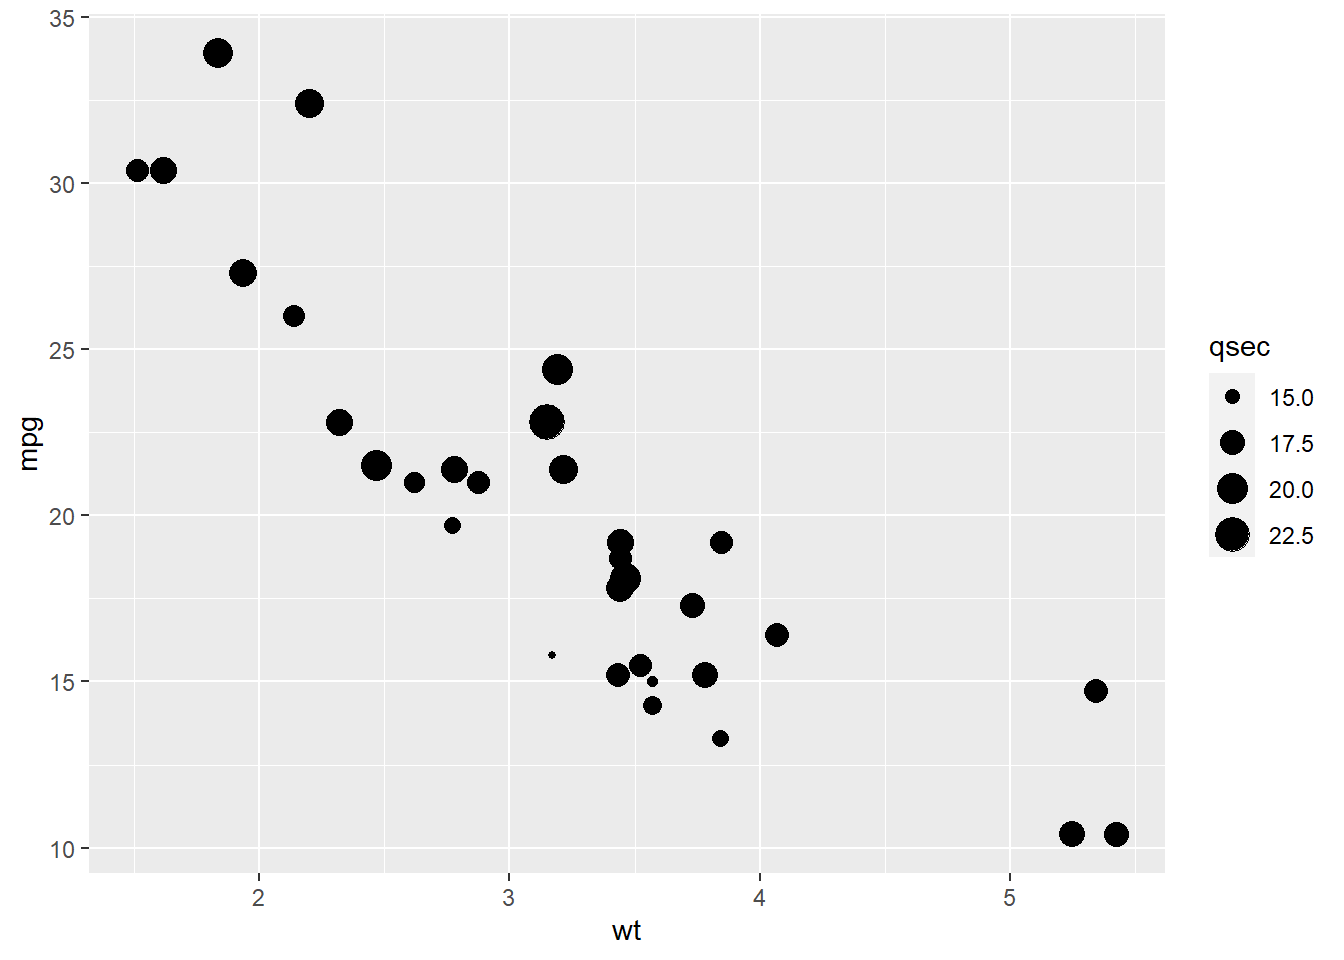
Manually setting aesthetics
ggplot(mtcars, aes(wt, mpg)) + geom_point(colour = "red", size = 3)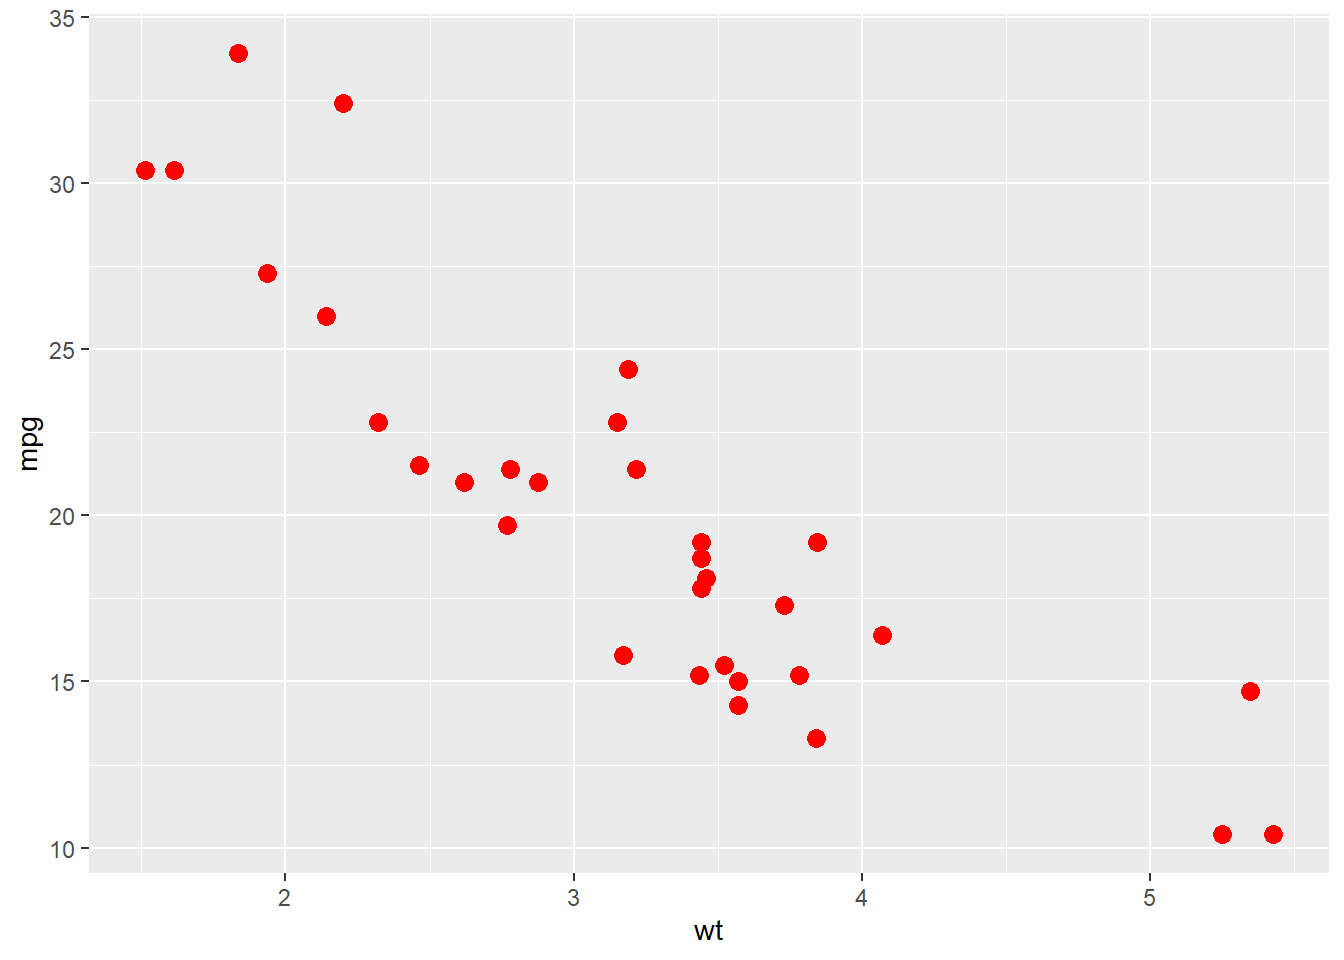
Optional shape arguments
For shapes that have a border (like shape 21), you can colour the inside and outside separately. Use the stroke aesthetic to modify the width of the border.
ggplot(mtcars, aes(wt, mpg)) +
  geom_point(shape = 21, colour = "black", fill = "white", size = 5, stroke = 5)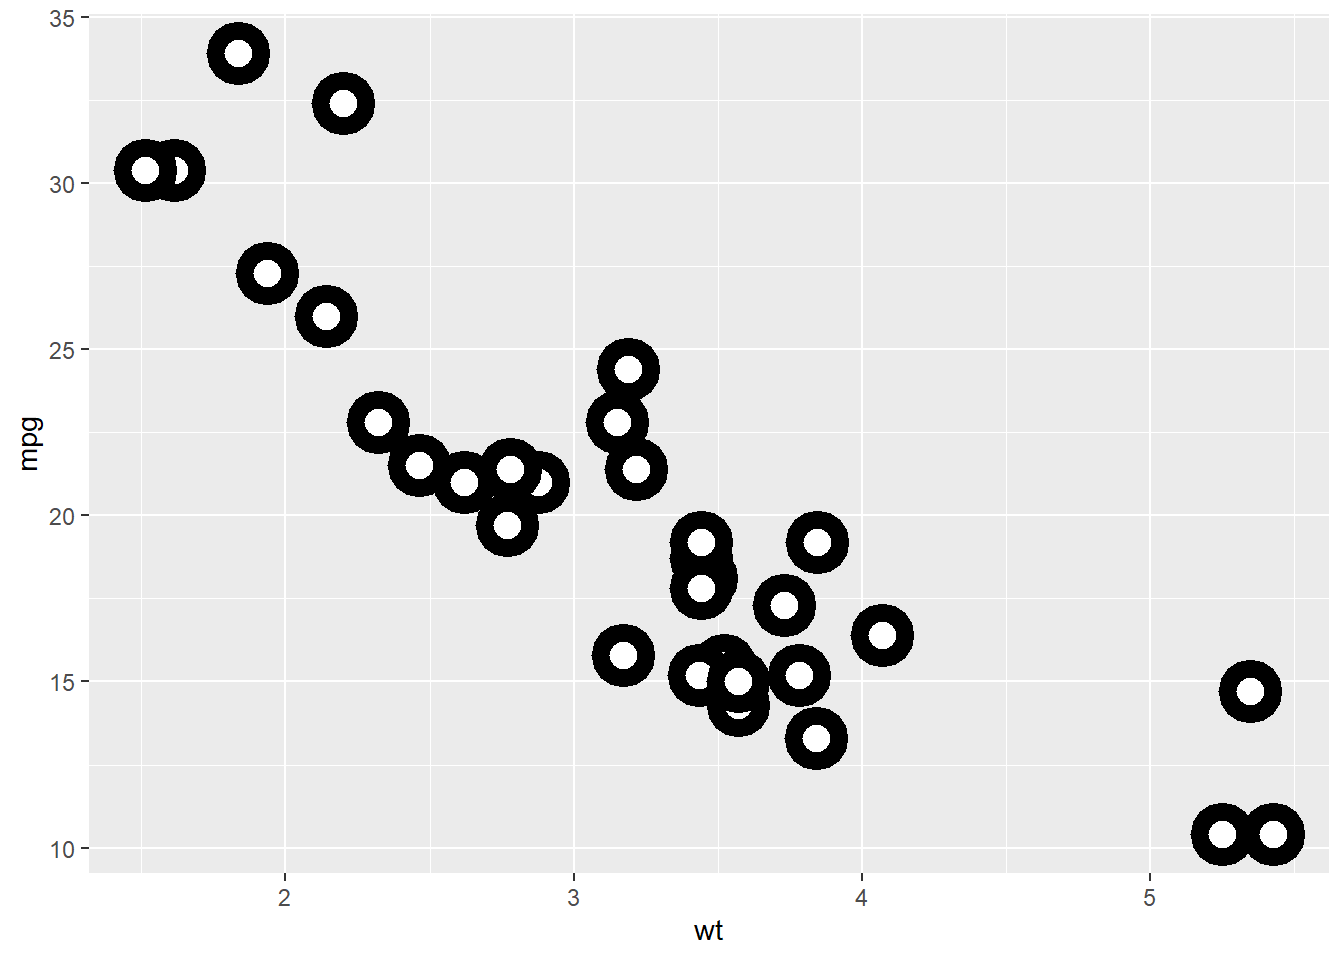
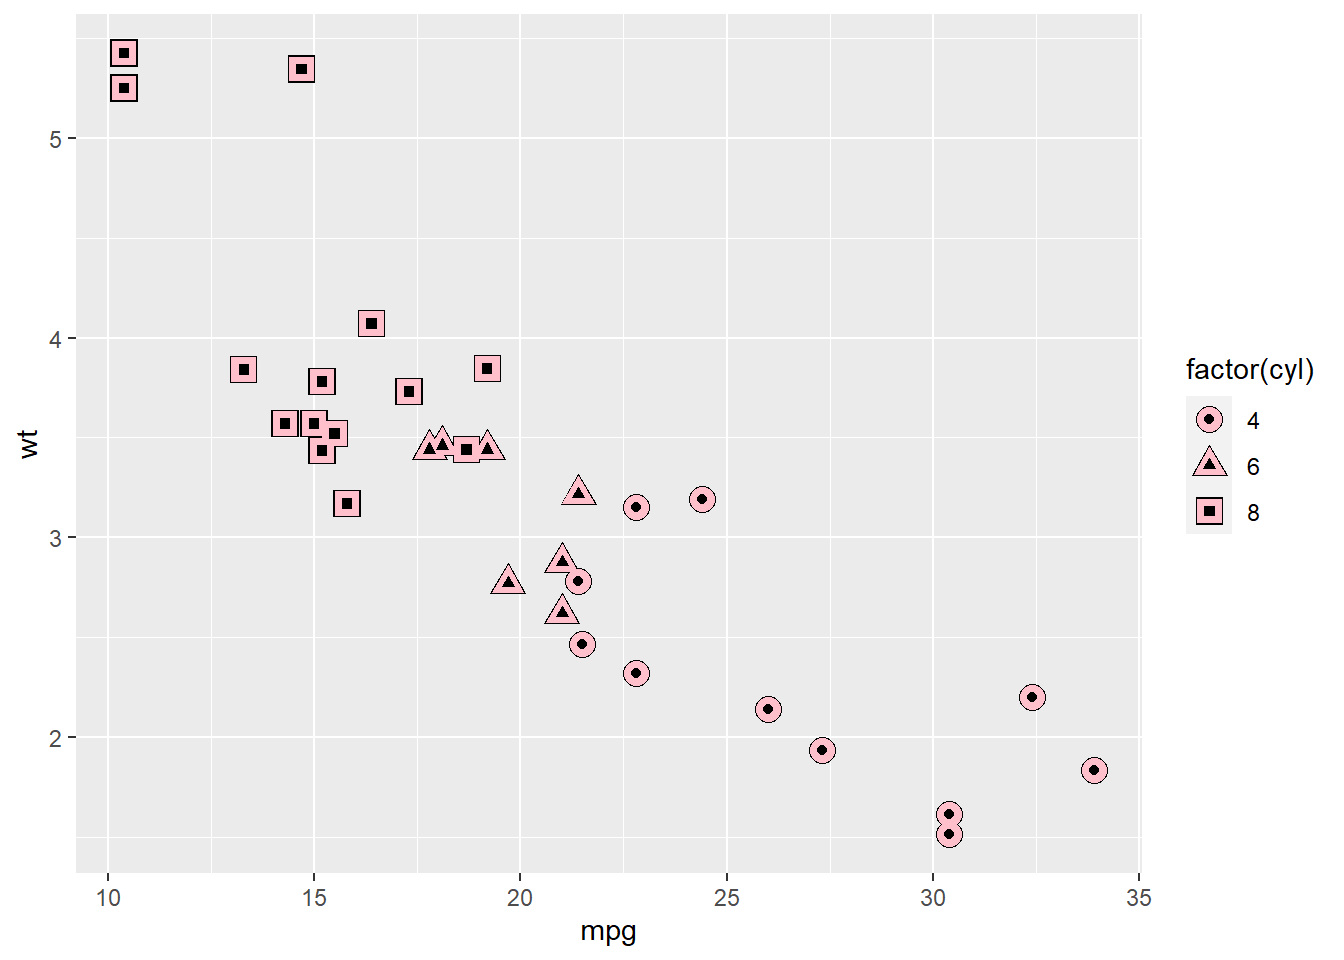
Mix multiples shapes
You can create interesting shapes by layering multiple points of different sizes.
Default plot
p <- ggplot(mtcars, aes(mpg, wt, shape = factor(cyl)))

p +
  geom_point(aes(colour = factor(cyl)), size = 4) +
  geom_point(colour = "grey90", size = 1.5)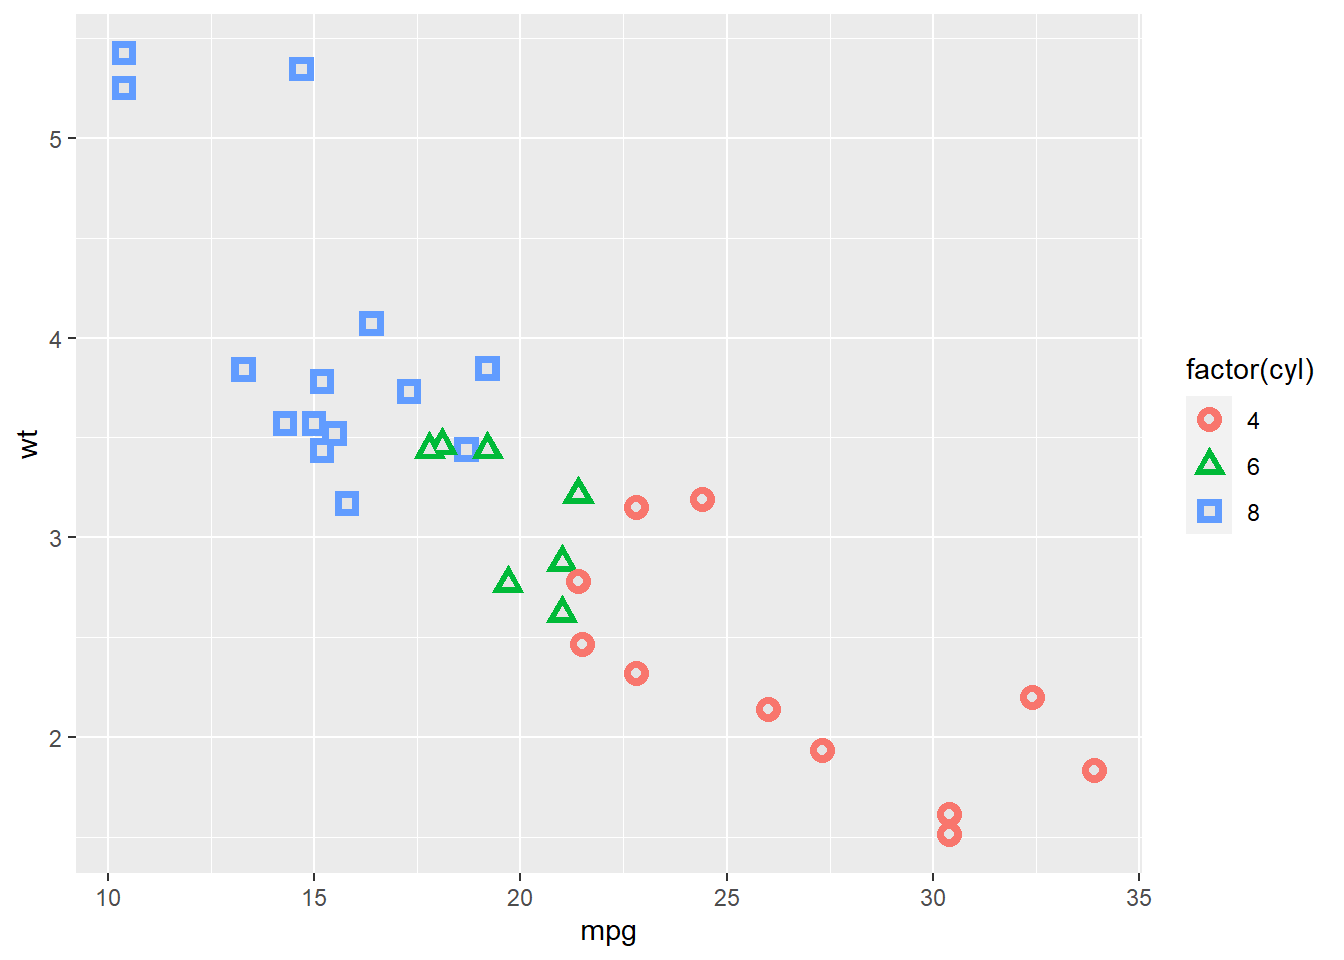
Mixed shapes
p <- ggplot(mtcars, aes(mpg, wt, shape = factor(cyl)))
p +
  geom_point(colour = "black", size = 4.5) +
  geom_point(colour = "pink", size = 4) +
  geom_point(aes(shape = factor(cyl)))