ggplot2 - practice
Solutions: https://www.paulamoraga.com/book-r/99-problems-ggplot2-practice-solutions.html
1 Facets
Dataset ggplot2::economics_long. Variables
date, value, variable.
library(ggplot2)
ggplot(economics_long, aes(date, value)) + geom_line() +
  facet_wrap(~variable, scales = "free_y", ncol = 1)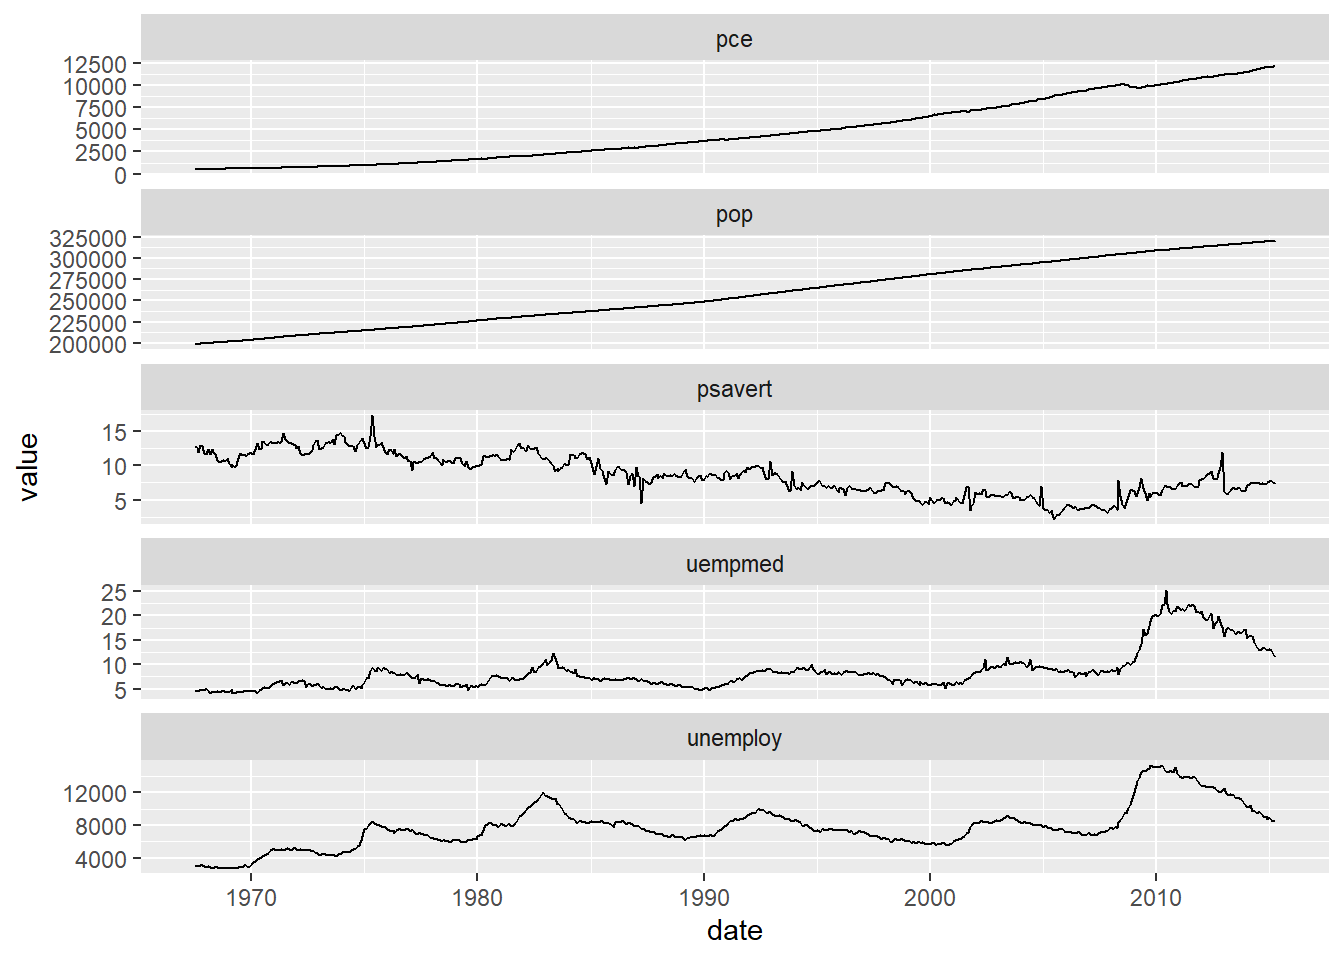
2 Labels
Dataset ggplot2::mpg. Variables displ,
hwy, cyl.
# 8.1. https://ggplot2-book.org/annotations.html
ggplot(mpg, aes(displ, hwy)) + geom_point(aes(colour = factor(cyl))) +
  labs(x = "Engine displacement (litres)", y = "Highway miles per gallon",
       colour = "Number of cylinders",
       title = "Mileage by engine size and cylinders",
       subtitle = "Source: http://fueleconomy.gov")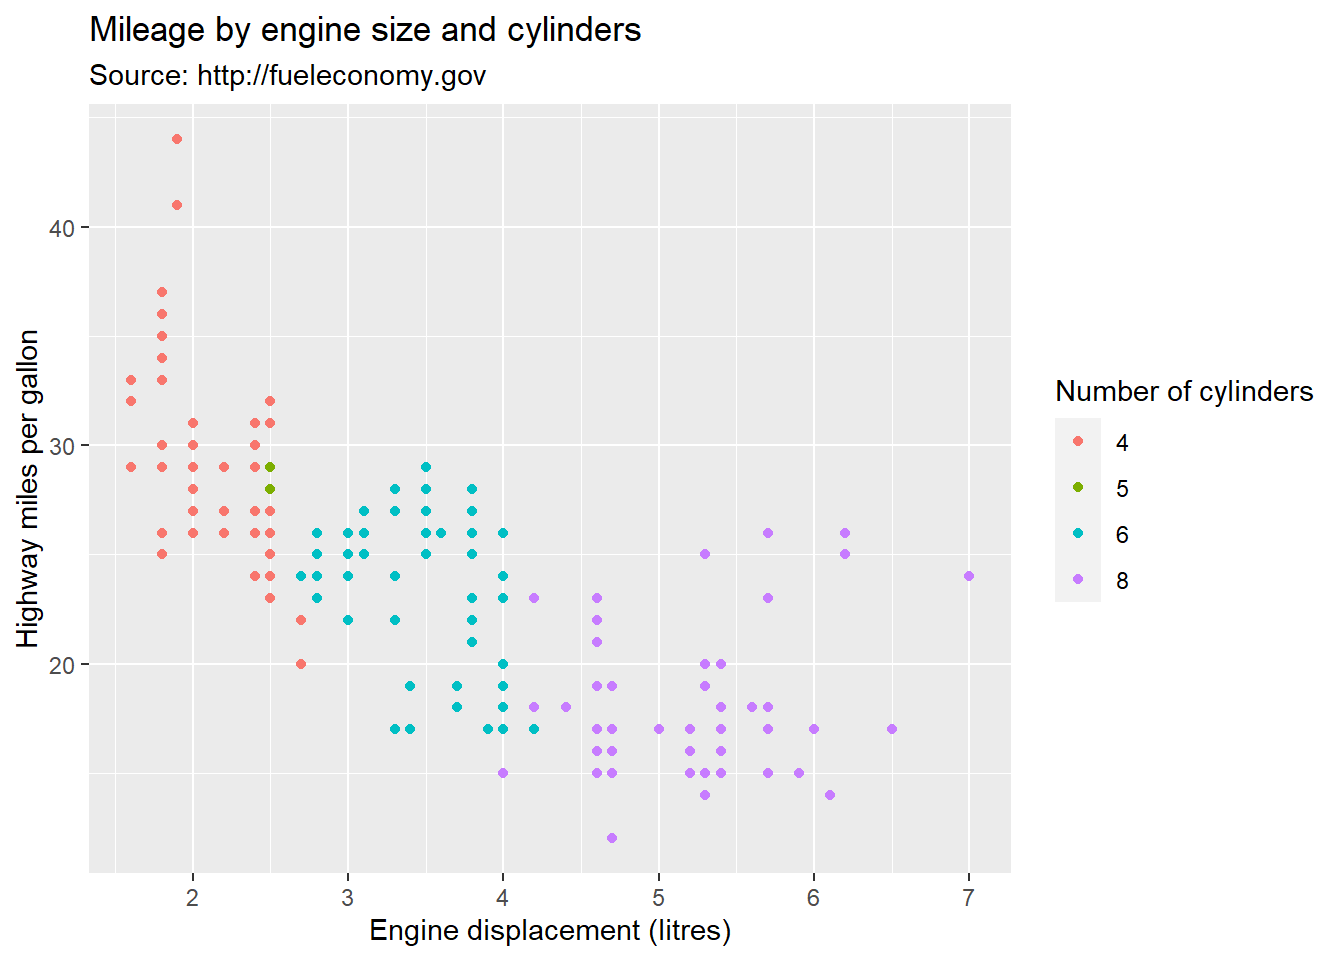
3 Boxplot
geom_gitter()to add a small amount of random variation to the location of each pointhrbrthemesfor additional packages: https://hrbrmstr.github.io/hrbrthemes/
library(tidyverse)
library(hrbrthemes)
library(viridis)

d <- data.frame(name = c(rep("A", 500), rep("B", 500), rep("B", 500), rep("C", 20), rep('D', 100)),
value = c(rnorm(500, 10, 5), rnorm(500, 13, 1), rnorm(500, 18, 1), rnorm(20, 25, 4), rnorm(100, 12, 1)))
# https://www.r-graph-gallery.com/89-box-and-scatter-plot-with-ggplot2.html
# https://ggplot2.tidyverse.org/reference/geom_jitter.html
ggplot(d, aes(x = name, y = value, fill = name)) +
geom_boxplot() +
scale_fill_viridis(discrete = TRUE, alpha = 0.6) +
geom_jitter(color = "black", size = 0.4, alpha = 0.9) +
theme_ipsum() +
theme(legend.position = "none", plot.title = element_text(size = 11)) +
ggtitle("A boxplot with jitter") + xlab("")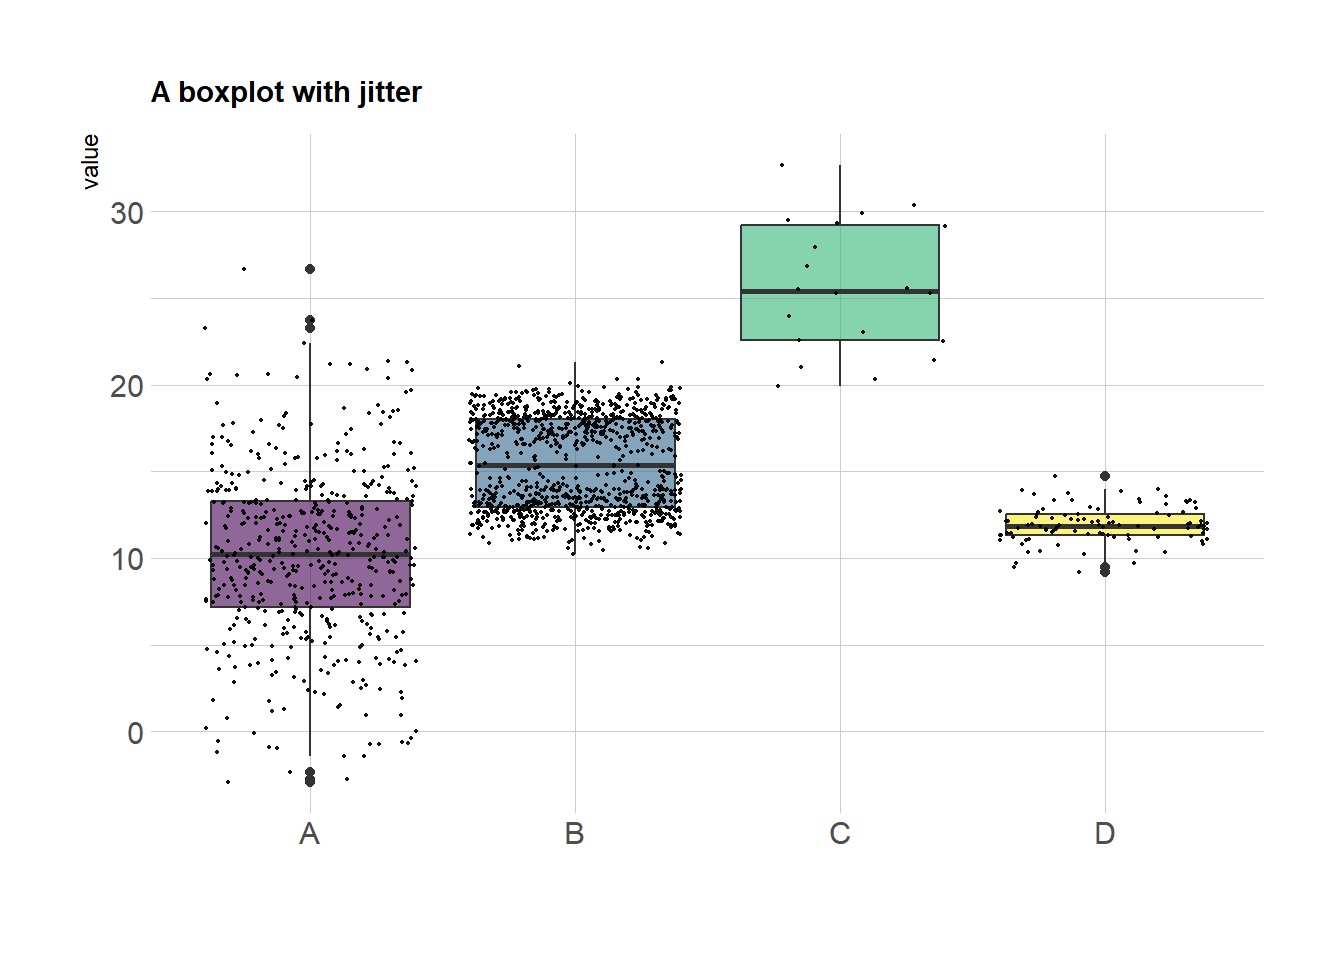
4 Make previous plots interactive with plotly::ggplotly()
5 gganimate
library(tidyverse)
library(viridis)
library(ggplot2)
library(gganimate)
library(babynames)
library(hrbrthemes)

# Keep only 3 names
d <- babynames %>% filter(name %in% c("Ashley", "Patricia", "Helen")) %>% filter(sex == "F")
# https://www.r-graph-gallery.com/287-smooth-animation-with-tweenr.html
ggplot(d, aes(x = year, y = n, color = name)) +
geom_line() + geom_point() +
scale_color_viridis(discrete = TRUE) +
ggtitle("Popularity of American names\n in the previous 30 years") +
theme_ipsum() +
ylab("Number of babies born") +
transition_reveal(year)
library(ggplot2)
library(gganimate)

a <- data.frame(group = c("A","B","C"), values = c(3,2,4), frame = rep('a', 3))
b <- data.frame(group = c("A","B","C"), values = c(5,3,7), frame = rep('b', 3))
d <- rbind(a,b)

ggplot(a, aes(x = group, y = values, fill = group)) + geom_bar(stat = 'identity')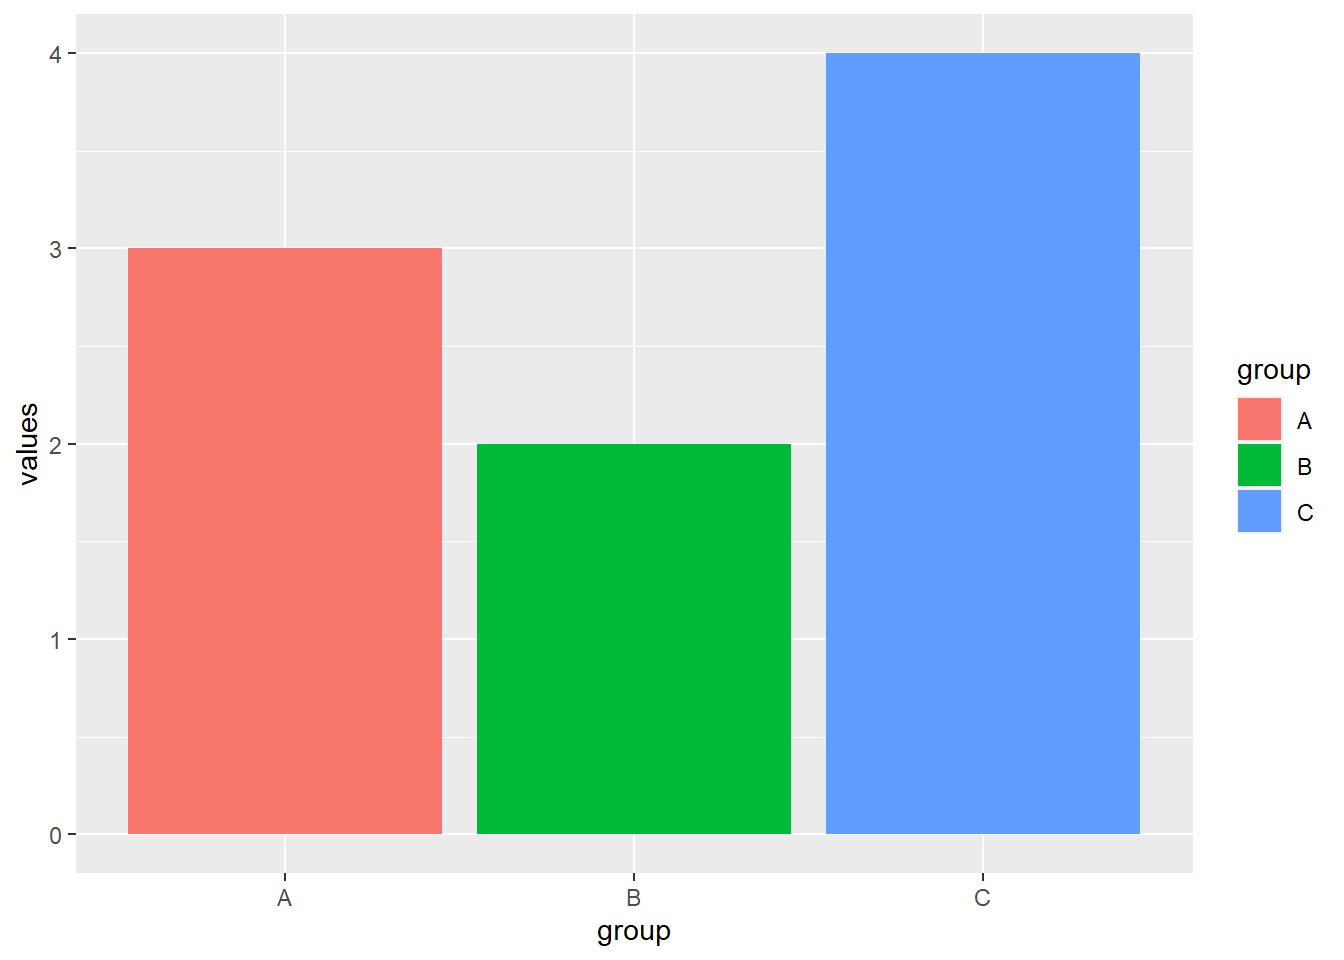
# https://www.r-graph-gallery.com/288-animated-barplot-transition.html
ggplot(d, aes(x = group, y = values, fill =group)) +
  geom_bar(stat = 'identity') + theme_bw() +
  transition_states(frame, transition_length = 2, state_length = 1) +
  ease_aes('sine-in-out')