18 The spatstat package
The spatstat package (Baddeley, Turner, and Rubak 2022) can be used for statistical analysis of spatial point patterns.
In spatstat, spatial point patterns are represented with objects of class ppp that contain the event locations with possibly associated marks, and the observation window where the events occur.
Here, we show how to use spatstat to create ppp objects representing spatial point patterns, and how to transform ppp objects to sf objects to be able to work with the data using packages such as sf.
18.1 Creating spatial point patterns
In spatstat, spatial point patterns are represented as objects of class ppp (planar point pattern). To create a ppp object, we use the ppp() function passing the vectors x and y with the event coordinates, and the observation window which is of class owin.
For example, here we create a spatial point pattern of 100 randomly generated points in the region \([0, 1] \times [0, 2]\).
First, we use the owin() function to create an object of class owin with the observation window \([0, 1] \times [0, 2]\) passing the ranges of the horizontal and vertical axes.
Then, we simulate 100 random points in the observation window \([0, 1] \times [0, 2]\).
Finally, we create the ppp object with the ppp() function passing the x and y coordinates of the events, and the owin object with the window.
X <- ppp(x = x, y = y, window = win)
X
Planar point pattern: 100 points
window: rectangle = [0, 1] x [0, 2] unitsFigure 18.1 shows the plot of the ppp object.
![Point pattern of 100 independent uniform random points generated in $[0, 1] \times [0, 2]$.](book-spatial_files/figure-html/ppspatstatppp-1.png)
FIGURE 18.1: Point pattern of 100 independent uniform random points generated in \([0, 1] \times [0, 2]\).
We can extract the observation window of the point pattern X with Window().
Window(X)window: rectangle = [0, 1] x [0, 2] unitsAn alternative way of simulating a spatial point pattern of independent uniform random points in a given region is by using the runifpoint() function.
The arguments of runifpoint() include the number n of points and the window of class owin where the point pattern is simulated. For example, the previous pattern could have been generated using X <- runifpoint(n = 100, win = win).
Marks denoting associated information of events can be set with marks() or %mark%. For example, Figure 18.2 shows the previous point pattern X where we add a mark with a numeric value to each of the events.
# set marks with marks()
marks(X) <- 1:npoints(X)
# alternatively, set marks with %mark%
X <- X %mark% 1:npoints(X)
plot(X)![Point pattern of 100 independent uniform random points generated in $[0, 1] \times [0, 2]$ with numeric marks.](book-spatial_files/figure-html/ppspatstatmarks-1.png)
FIGURE 18.2: Point pattern of 100 independent uniform random points generated in \([0, 1] \times [0, 2]\) with numeric marks.
Note that the definition of an observation window that represents the study region of the point pattern needs to be carefully specified, as it affects the visualization and analysis of the data, and possibly the conclusions obtained. For example, if the previous point pattern was thought to be observed in the window \([0, 5] \times [0, 5]\), the data would appear as a cluster in the bottom left corner of the window instead of randomly in \([0, 1] \times [0, 2]\). Note that this situation, depicted in Figure 18.3, would change the interpretation of the data.
win2 <- owin(xrange = c(0, 5), yrange = c(0, 5))
X2 <- ppp(x = x, y = y, window = win2)
plot(X2)
axis(1)
axis(2)![Point pattern of 100 independent uniform random points generated in $[0, 1] \times [0, 2]$ plotted in $[0, 5] \times [0, 5]$.](book-spatial_files/figure-html/ppspatstatothewindow-1.png)
FIGURE 18.3: Point pattern of 100 independent uniform random points generated in \([0, 1] \times [0, 2]\) plotted in \([0, 5] \times [0, 5]\).
The inside.owin() function can be used to test whether a set of points lie within a particular observation window.
For example, we can identify the points in the point pattern X that are inside the unit square by passing the points and the observation window as follows:
win <- owin() # unit square observation window
marks(X) <- inside.owin(X, w = win)
plot(X)
axis(1)
axis(2)![Point pattern of 100 independent uniform random points generated in $[0, 1] \times [0, 2]$ with labels that indicate whether points lie inside or outside the unit square.](book-spatial_files/figure-html/ppstatstatinsideowin-1.png)
FIGURE 18.4: Point pattern of 100 independent uniform random points generated in \([0, 1] \times [0, 2]\) with labels that indicate whether points lie inside or outside the unit square.
18.2 Converting between ppp and sf objects
From ppp to sf
In some situations, we may be interested in transforming an object of class ppp to an object of class sf to be able to manipulate and visualize the data using other packages such as sf.
Here, we show how to use the st_as_sf() function from sf to transform
the longleaf data from sptatstat which contains the locations and sizes of longleaf pine trees, from ppp to sf class.
First, we create a data frame containing the coordinates and the marks of the ppp object.
Then, we create a sf object by using the st_as_sf() function of sf passing the data frame and specifying the name of the columns that contain the event coordinates in argument coords.
The window of the point pattern can also be converted to sf with st_as_sf(Window(X)).
From sf to ppp
We can also convert a sf object to a ppp object with as.ppp() by providing the point coordinates and the observation window.
For example, here we obtain the coordinates of the sf object in matrix form with st_coordinates(), and consider the observation window as the bounding box of the data which can be obtained with st_bbox().
Marks of the points can be set with marks() or %mark%.
Figure 18.5 shows the plot of the ppp object obtained.
X <- as.ppp(st_coordinates(d), st_bbox(d))
marks(X) <- d$m # alternatively we can use X <- X %mark% d$m
plot(X)
In case we wish to use a polygon of class sf as observation window,
we can use as.owin() to transform the sf object to an owin object. Note that the sf object needs to be in a projected coordinate reference system.
Here, we show an example on how to create a spatial point pattern with the boundary of Brazil as observation window.
First, we obtain the Brazil map with the rnaturalearth package.
Then, we use st_transform() to transform the map to projection EPSG 29172 (UTM zone 22N).
Finally, we use runifpoint() to generate 100 independent uniform random points within the observation window (Figure 18.5).
library(rnaturalearth)
map <- ne_countries(type = "countries", country = "Brazil",
                    scale = "medium", returnclass = "sf")
map <- st_transform(map, crs = "EPSG:29172")
win <- as.owin(map)
X <- runifpoint(100, win = win)
plot(X)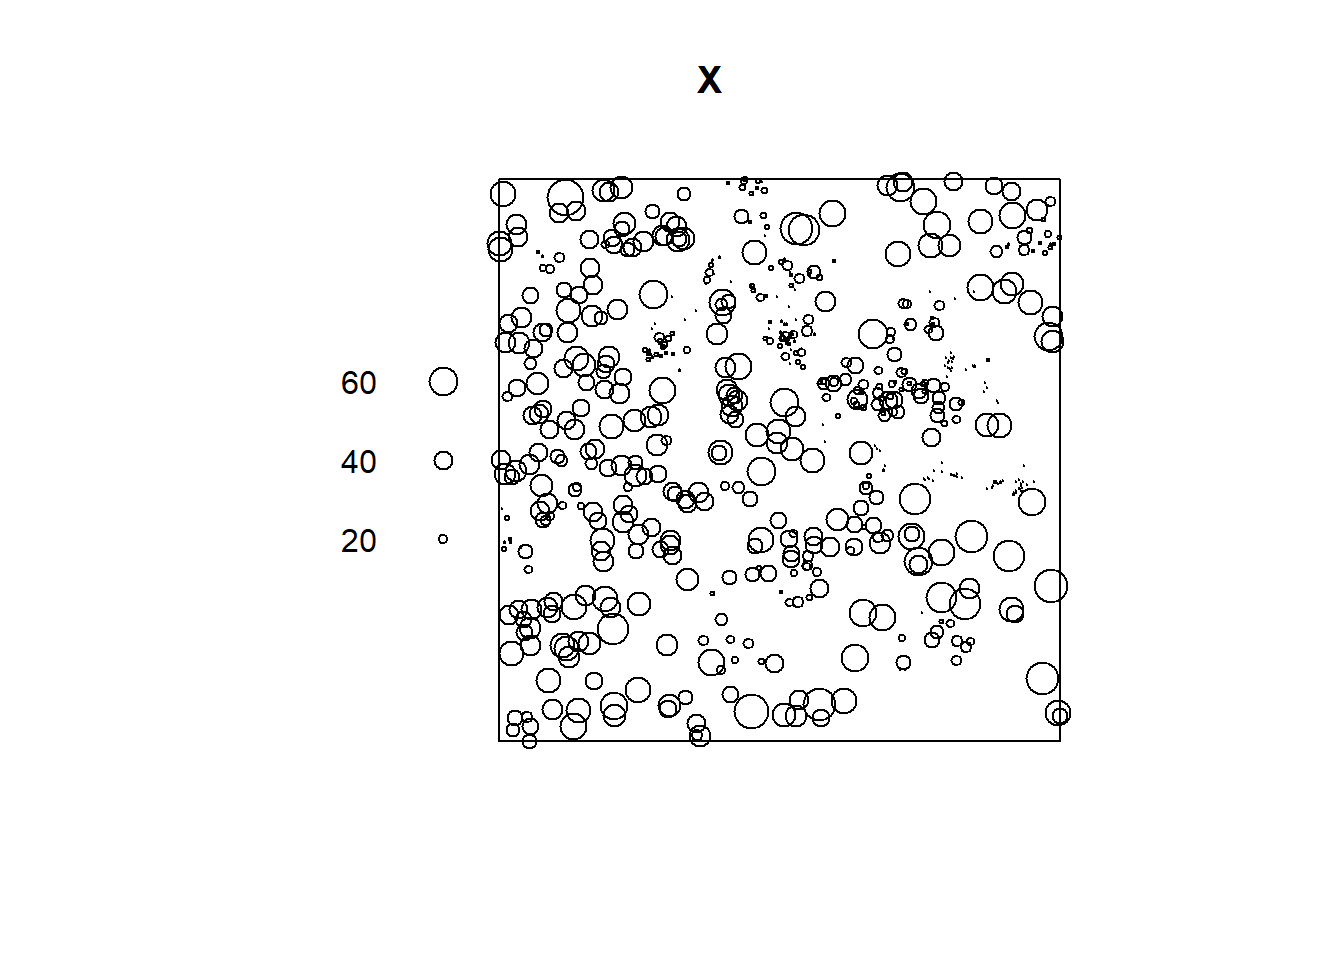
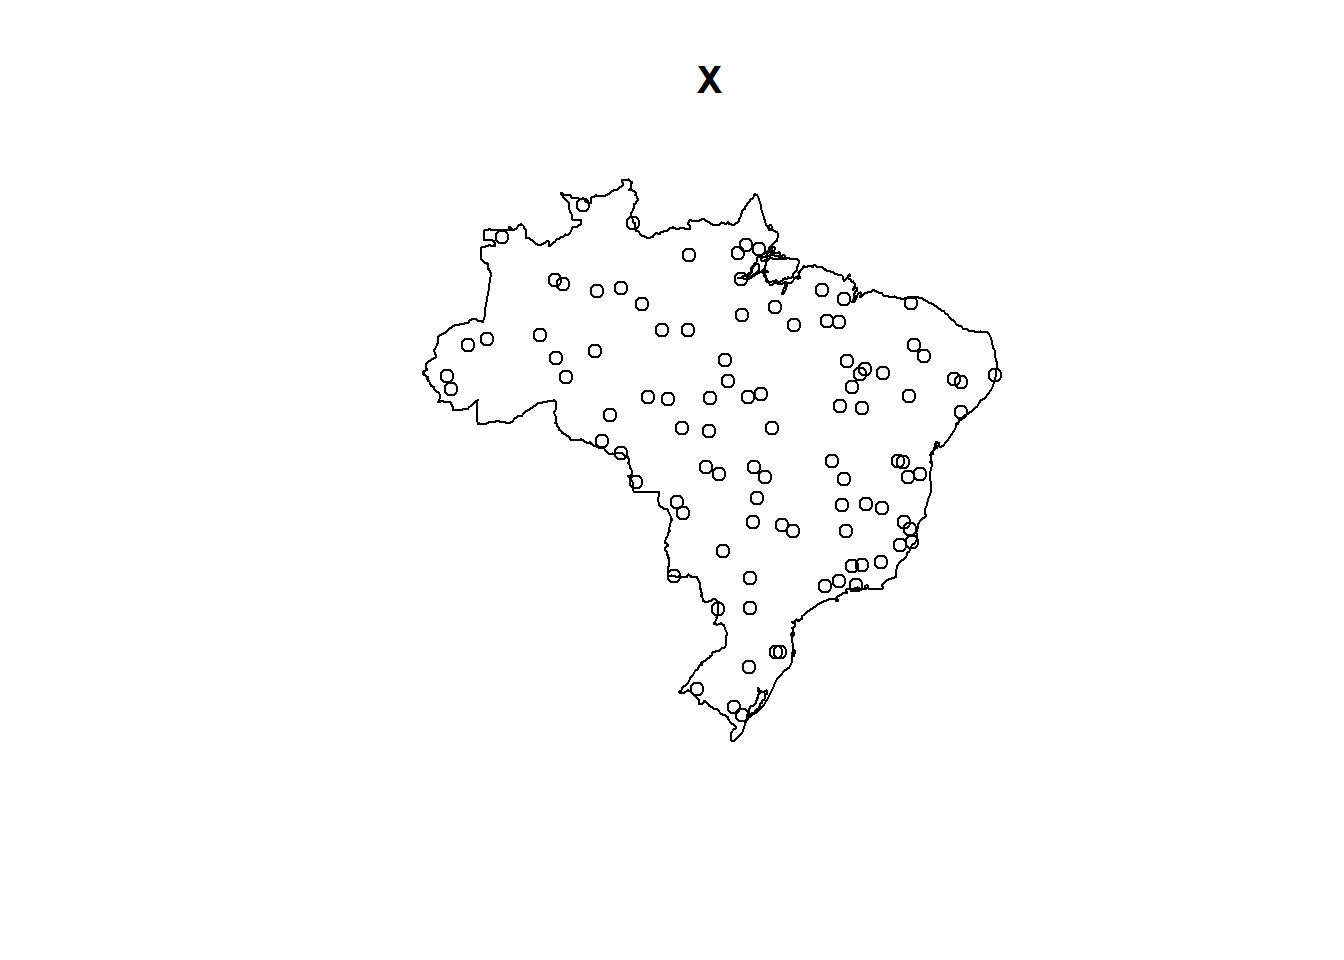
FIGURE 18.5: Spatial point pattern converted from sf to ppp considering the observation window as the bounding box of the data (top) and as a polygon (bottom).