12 Interactions
12.1 Interactions
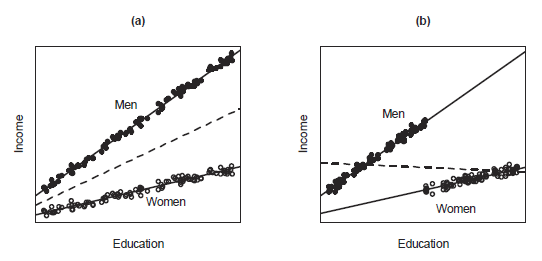
Two explanatory variables interact in determining a response variable when the partial effect of one depends on the value of the other.
In (a) gender and education are independent, since women and men have identical education distributions.
In (b) gender and education are related, since women, on average, have higher levels of education than men.
In both (a) and (b), the within-gender regressions of income on education are not parallel - the slope for men is larger than the slope for women.
Because the effect of education varies by gender, education and gender interact in affecting income.
Also, the effect of gender varies by education. Because the regressions are not parallel, the relative income advantage of men with respect of women changes with education.
Interaction is a symmetric concept - the effect of education varies by gender, and the effect of gender varies by education.
Interaction refers to the manner in which explanatory variables combine to affect a response variable, not to the relationship between the explanatory variables themselves.
The following model accommodates different intercepts and slopes for women and men. Along with the dummy regressor for gender (\(D = 1\) if men, \(D = 0\) if women), and the quantitative regressor \(X\) for education, the interaction regressor \(X \times D\) is introduced.
\[Y_i = \alpha + \beta X_i + \gamma D_i + \delta (X_i D_i) + \epsilon_i\]
For women, \(Y_i = \alpha + \beta X_i + \gamma (0) + \delta (X_i \times 0) + \epsilon_i = \alpha + \beta X_i + \epsilon_i\)
For men, \(Y_i = \alpha + \beta X_i + \gamma (1) + \delta (X_i \times 1) + \epsilon_i = (\alpha + \gamma) + (\beta + \delta) X_i + \epsilon_i\)
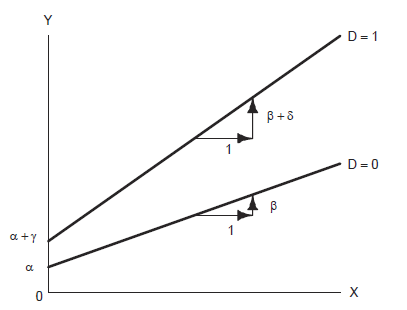
- \(\alpha\) and \(\beta\) are the intercept and slope for the regression of income on education among women
- \(\gamma\) gives the difference in intercepts between the male and female groups
- \(\delta\) gives the difference in slopes between the two groups
12.2 Examples categorical variables and interactions
Exercise. Credit data
The Credit data from the ISLR package contains simulated information on ten thousand customers.
Balance(average credit card debt for a number of individuals)Gender(Male, Female)Ethnicity(African American, Asian, Caucasian)Income(in thousand dollars)Student(No, Yes)
- Investigate differences in credit card balance between males and females.
- Investigate differences in credit card balance between ethnic groups.
- Predict balance using income and student.
- Predict balance using income, student, and their interaction.
\[E[Y] = \beta_0 + \beta_1 \mbox{income} + \beta_2 \mbox{Dstudent} + \beta_3 \mbox{income} \times \mbox{Dstudent}\]
If student: \(E[Y] = (\beta_0 + \beta_2) + (\beta_1+\beta_3) \mbox{income}\)
If no student: \(E[Y] = \beta_0 + \beta_1 \mbox{income}\)