26 Parametric survival models
26.1 Parametric survival distributions
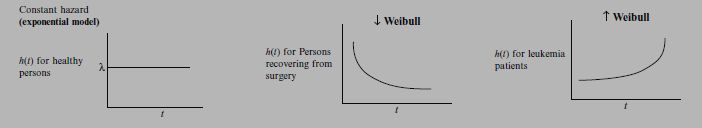
26.1.1 Exponential distribution
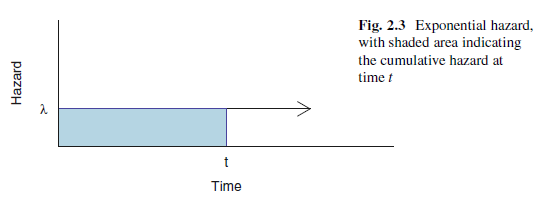
The exponential distribution has a constant hazard function:
\[h(t) = \lambda\] The constant hazard function gives the memory-less property. That is, the risk of having the event of interest is the same at any point in time as it was at the beginning.
Cumulative hazard function: \[H(t) = \int_0^t h(u)du = \int_0^t \lambda du = \lambda t|_0^t = \lambda t\] Survival function: \[S(t) = exp(-H(t)) = exp(- \lambda t)\] Probability density function: \[f(t) = h(t)S(t) = \lambda exp(-\lambda t)\]
dexp() computes the pdf and pexp() computes the cdf of the exponential distribution. To obtain the survival function we use pexp() by specifying lower.tail = FALSE.
rate <- 0.03

# Survival function: S(t)
surv <- function(t, rate){
pexp(t, rate = rate, lower.tail = FALSE)}

# Hazard function: h(t) = f(t)/S(t)
haz <- function(t, rate){
dexp(t, rate = rate)/
pexp(t, rate = rate, lower.tail = FALSE)}

# Plot
par(mfrow = c(1, 2))
curve(surv(x, rate = rate),
from = 0, to = 80, ylab = "S(t)", xlab = "t", ylim = c(0, 1))
curve(haz(x, rate = rate),
from = 0, to = 80, ylab = "h(t)", xlab = "t")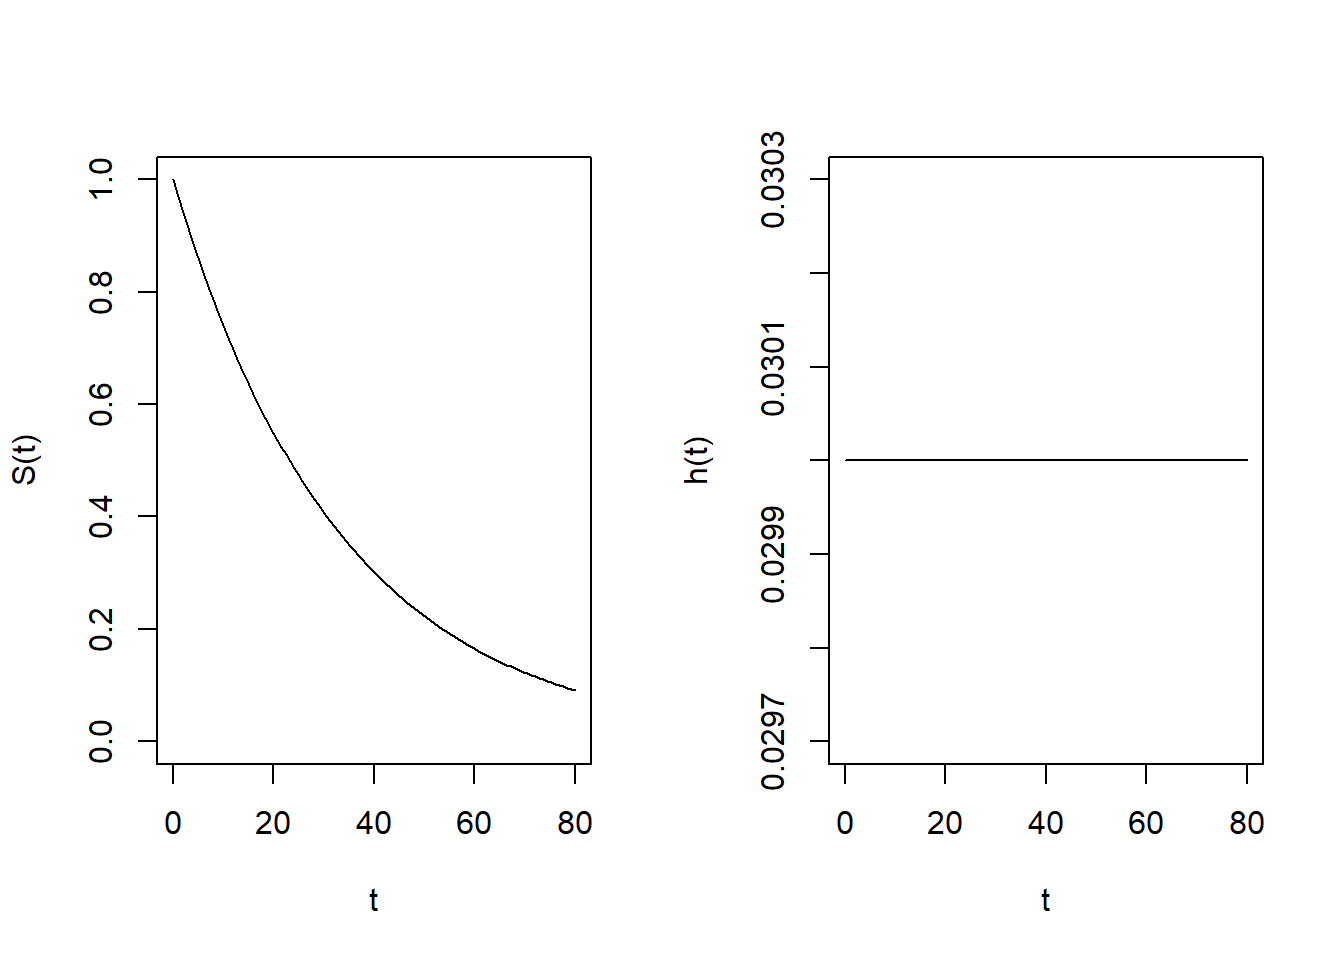
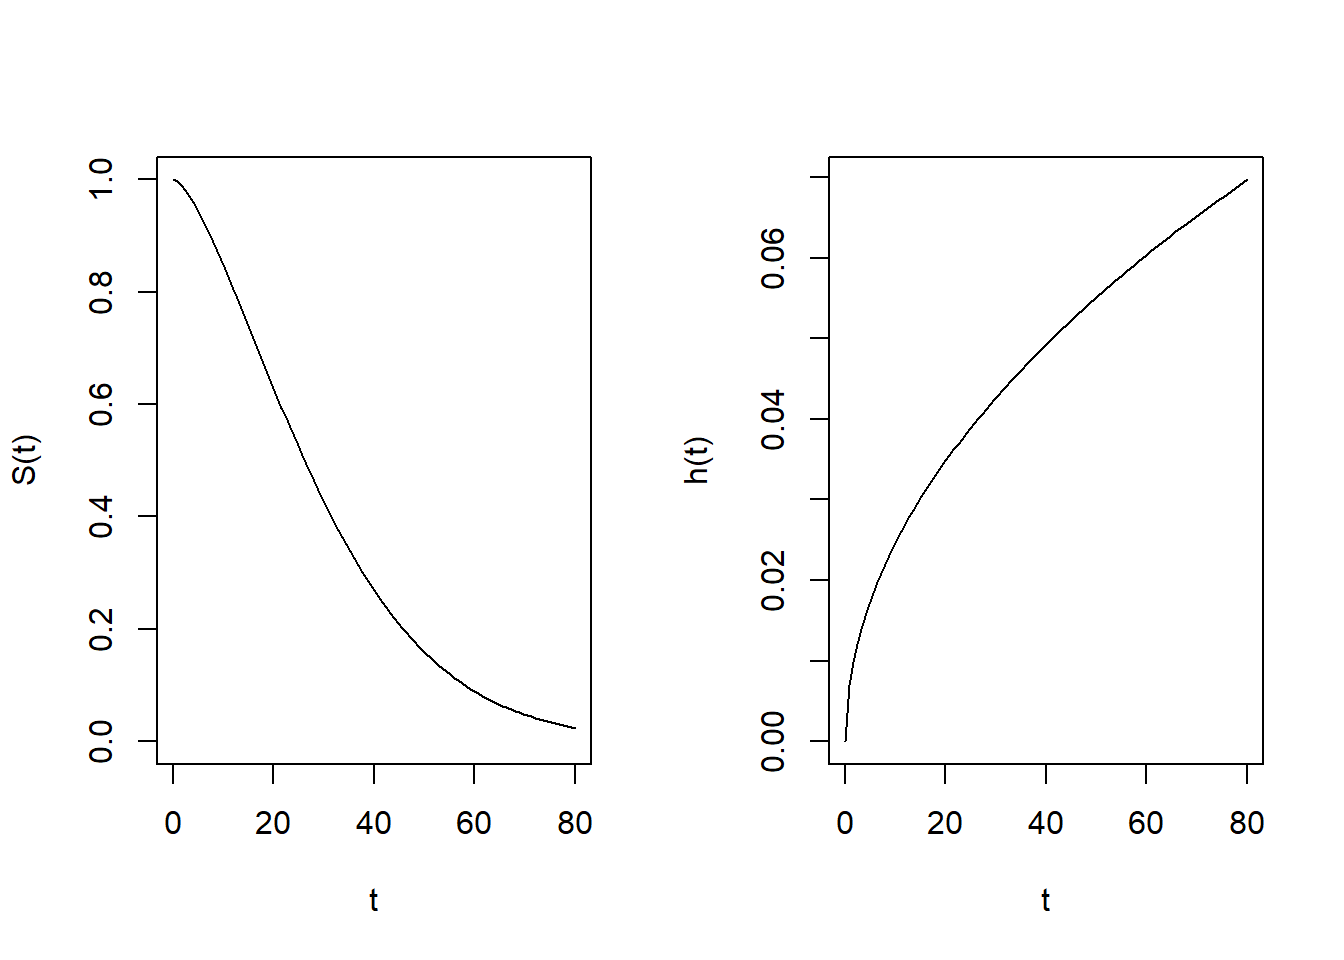
26.1.2 Weibull distribution
Hazard function:
\[h(t) = \alpha \lambda (\lambda t)^{\alpha-1}= \alpha \lambda^{\alpha} t^{\alpha-1}\] Cumulative hazard function:
\[H(t) = \int_0^t h(u)du = \int_0^t \alpha \lambda^{\alpha} u^{\alpha-1} du = (\lambda t)^{\alpha}\]
Survival function:
\[S(t) = exp(-H(t)) = exp(- (\lambda t)^{\alpha})\]
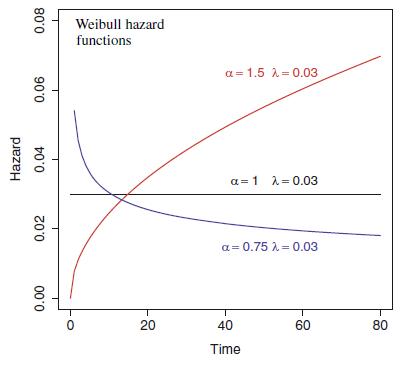
In the Weibull model, \(\alpha > 0\) is the shape parameter and \(\lambda > 0\) is the rate parameter. The hazard function is monotone increasing for \(\alpha > 1\), monotone decreasing for \(\alpha < 1\), and constant for \(\alpha = 1\). The exponential distribution is a special case of Weibull with \(\alpha=1\).
dweibull() computes the pdf and pweibull() computes the cdf of the Weibull distribution. These functions use the arguments shape (to represent \(\alpha\)) and scale to represent (\(1/\lambda\)). To obtain the survival function we use pweibull() by specifying lower.tail = FALSE.
alpha <- 1.5
lambda <- 0.03

# Survival function: S(t)
surv <- function(t, shape, scale){
pweibull(t, shape = shape, scale = scale, lower.tail = FALSE)}

# Hazard function: h(t) = f(t)/S(t)
haz <- function(t, shape, scale){
dweibull(t, shape = shape, scale = scale)/
pweibull(t, shape = shape, scale = scale, lower.tail = FALSE)}

# Plot
par(mfrow = c(1, 2))
curve(surv(x, shape = alpha, scale = 1/lambda),
from = 0, to = 80, ylab = "S(t)", xlab = "t", ylim = c(0, 1))
curve(haz(x, shape = alpha, scale = 1/lambda),
from = 0, to = 80, ylab = "h(t)", xlab = "t")