38 LM 5. Assumptions and unusual observations
38.1 Unusual observations
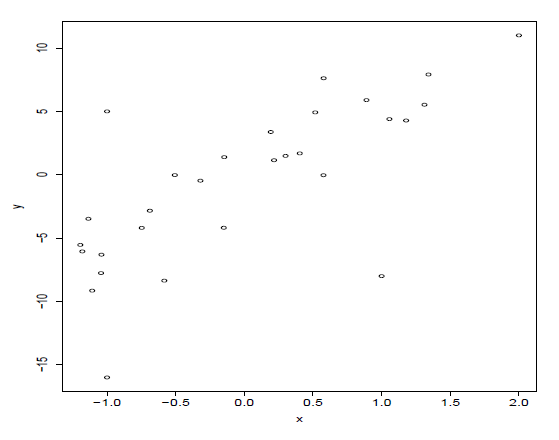
Below is a scatter plot for a data set. Identify the outliers in the data set. Which of \(R^2\), \(\hat \sigma\), \(se(\hat \beta_1)\) and the t-value for testing \(H_0: \beta_1 = 0\) would change if you drop these outliers (all of them at once)? Justify your answers.
Unusual observations. Solutions
Outlier 1: (x,y)=(1,-9). Outlier 2: (x,y)=(-1,5). Outlier 3: (x,y)=(-1,-16). The observation at (2, 10) is high leverage.
If you drop all outliers, the \(R^2\) would increase (better fit) and \(\hat \sigma\) would decrease.
\(t = \frac{\hat \beta_1}{se(\hat \beta_1)},\ \ se(\hat \beta_1) = \hat \sigma \sqrt{ (X'X)^{-1}_{11} }\)
The slope would probably increase a bit without the outliers so the numerator in the t-test would increase. The SE would decrease somewhat (depending on how much \(\hat \sigma\) decreases compared to the sample size reduction) and so the t would increase (but would also be compared to another t-distribution with 3 fewer degrees of freedom (more long-tailed).
38.2 Assumptions
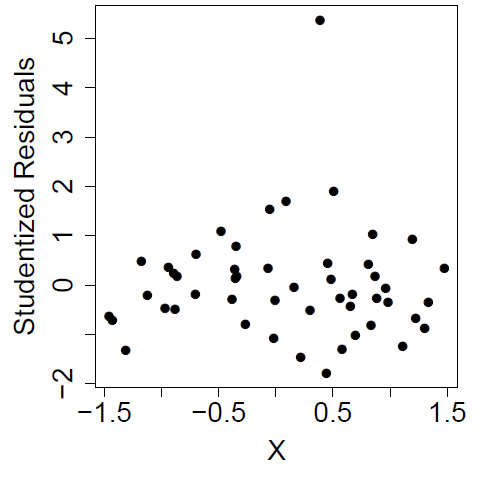
- The plot below represents output of a linear regression model. Based on the plot, describe what you think is problematic. If there is a potential problem, what would your next step(s) be?
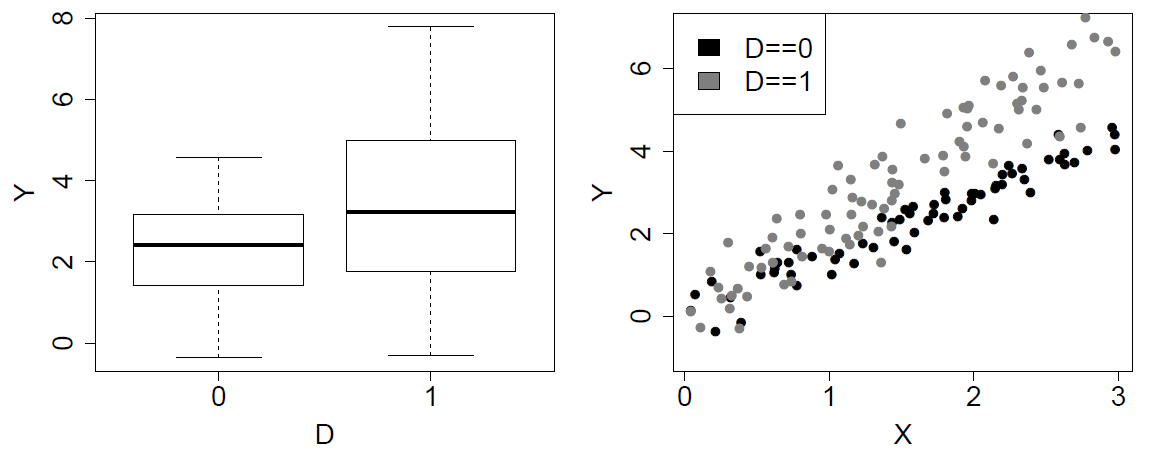
Plotted below are data on 3 variables: a continuous \(Y\), a continous \(X\), and a binary variable \(D \in \{0, 1\}\).
Based on these plots, please specify the model that you would recommend where \(Y\) is the outcome and \(X\) and \(D\) are the independent variables.
Based on these plots, which, if any, of the standard linear regression assumptions are violated? Justify your response.
Assumptions. Solutions
There is a potential outlier: the single point with the very large residual. The next step would be to investigate this point and see if there is a non-statistical reason to remove it. Then check whether it is influential.
\(Y = \beta_0 + \beta_1 D + \beta_2 X + \beta_3 X \times D + \epsilon\) because the second plot clearly shows different slopes.
Non-constant variance.